Immigrants from Nepal vs Tongan 3rd Grade
COMPARE
Immigrants from Nepal
Tongan
3rd Grade
3rd Grade Comparison
Immigrants from Nepal
Tongans
97.5%
3RD GRADE
5.3/ 100
METRIC RATING
218th/ 347
METRIC RANK
97.5%
3RD GRADE
4.3/ 100
METRIC RATING
225th/ 347
METRIC RANK
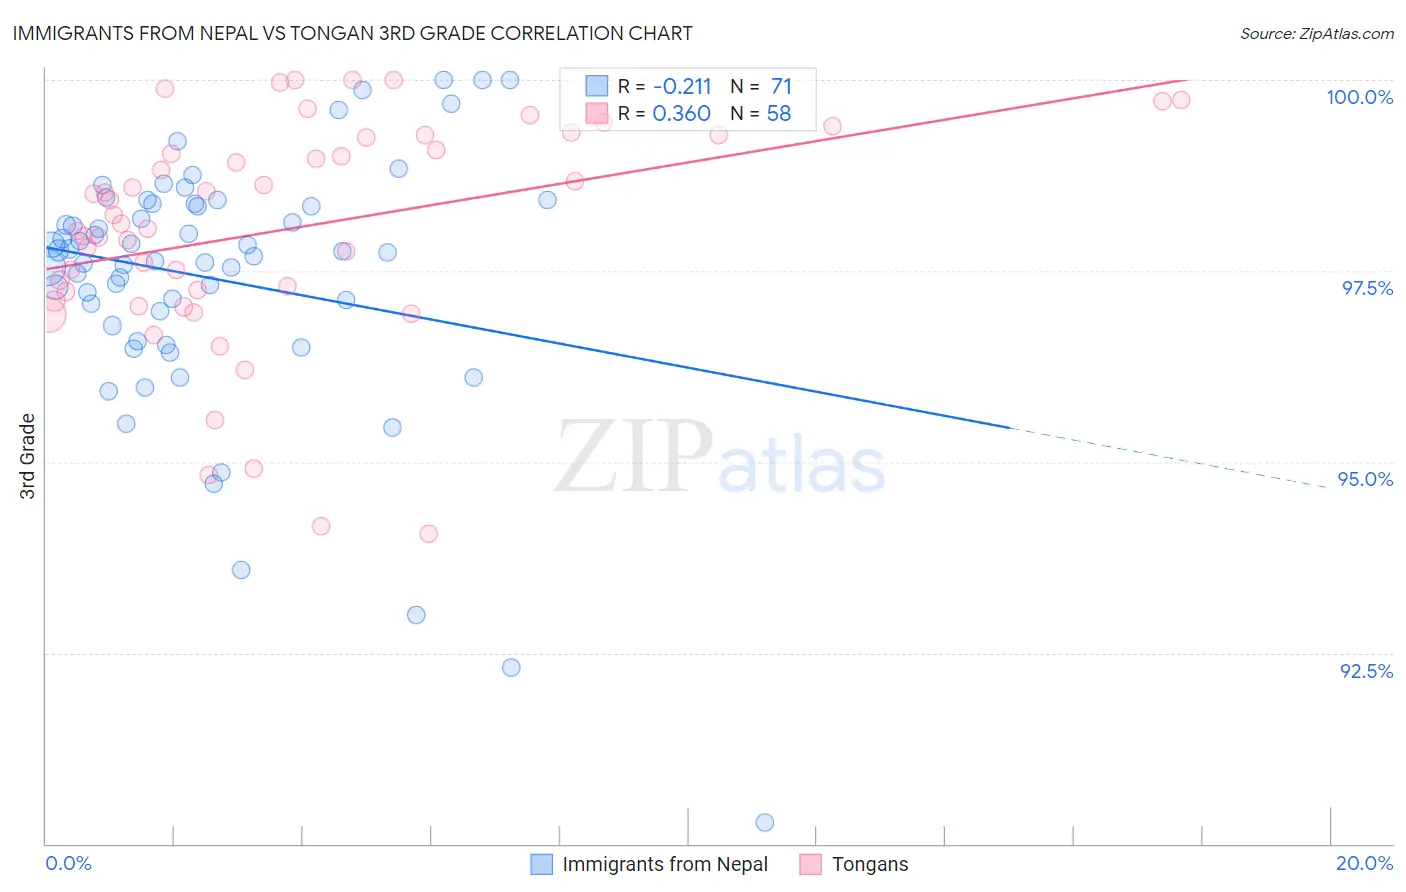
Immigrants from Nepal vs Tongan 3rd Grade Correlation Chart
The statistical analysis conducted on geographies consisting of 186,739,570 people shows a weak negative correlation between the proportion of Immigrants from Nepal and percentage of population with at least 3rd grade education in the United States with a correlation coefficient (R) of -0.211 and weighted average of 97.5%. Similarly, the statistical analysis conducted on geographies consisting of 102,908,759 people shows a mild positive correlation between the proportion of Tongans and percentage of population with at least 3rd grade education in the United States with a correlation coefficient (R) of 0.360 and weighted average of 97.5%, a difference of 0.020%.
3rd Grade Correlation Summary
| Measurement | Immigrants from Nepal | Tongan |
| Minimum | 90.3% | 94.1% |
| Maximum | 100.0% | 100.0% |
| Range | 9.7% | 5.9% |
| Mean | 97.4% | 98.0% |
| Median | 97.7% | 98.2% |
| Interquartile 25% (IQ1) | 96.8% | 97.2% |
| Interquartile 75% (IQ3) | 98.4% | 99.3% |
| Interquartile Range (IQR) | 1.6% | 2.0% |
| Standard Deviation (Sample) | 1.7% | 1.5% |
| Standard Deviation (Population) | 1.7% | 1.4% |
Demographics Similar to Immigrants from Nepal and Tongans by 3rd Grade
In terms of 3rd grade, the demographic groups most similar to Immigrants from Nepal are Immigrants from Panama (97.5%, a difference of 0.0%), Immigrants from Morocco (97.5%, a difference of 0.0%), South American Indian (97.5%, a difference of 0.010%), Uruguayan (97.5%, a difference of 0.010%), and Sierra Leonean (97.5%, a difference of 0.010%). Similarly, the demographic groups most similar to Tongans are Sierra Leonean (97.5%, a difference of 0.0%), Immigrants from Syria (97.5%, a difference of 0.0%), Bahamian (97.5%, a difference of 0.0%), Sudanese (97.5%, a difference of 0.0%), and Immigrants from Morocco (97.5%, a difference of 0.010%).
| Demographics | Rating | Rank | 3rd Grade |
| Laotians | 9.4 /100 | #211 | Tragic 97.6% |
| Immigrants | Bahamas | 8.5 /100 | #212 | Tragic 97.6% |
| Moroccans | 8.5 /100 | #213 | Tragic 97.6% |
| Yuman | 8.4 /100 | #214 | Tragic 97.6% |
| Iraqis | 6.9 /100 | #215 | Tragic 97.5% |
| Samoans | 6.9 /100 | #216 | Tragic 97.5% |
| South American Indians | 5.7 /100 | #217 | Tragic 97.5% |
| Immigrants | Nepal | 5.3 /100 | #218 | Tragic 97.5% |
| Immigrants | Panama | 5.2 /100 | #219 | Tragic 97.5% |
| Immigrants | Morocco | 5.0 /100 | #220 | Tragic 97.5% |
| Uruguayans | 5.0 /100 | #221 | Tragic 97.5% |
| Sierra Leoneans | 4.6 /100 | #222 | Tragic 97.5% |
| Immigrants | Syria | 4.4 /100 | #223 | Tragic 97.5% |
| Bahamians | 4.4 /100 | #224 | Tragic 97.5% |
| Tongans | 4.3 /100 | #225 | Tragic 97.5% |
| Sudanese | 4.1 /100 | #226 | Tragic 97.5% |
| Immigrants | Sudan | 3.4 /100 | #227 | Tragic 97.5% |
| Sub-Saharan Africans | 3.2 /100 | #228 | Tragic 97.5% |
| Senegalese | 3.0 /100 | #229 | Tragic 97.5% |
| Immigrants | Pakistan | 2.7 /100 | #230 | Tragic 97.5% |
| Immigrants | Costa Rica | 2.7 /100 | #231 | Tragic 97.5% |