Immigrants from Nepal vs Bahamian 7th Grade
COMPARE
Immigrants from Nepal
Bahamian
7th Grade
7th Grade Comparison
Immigrants from Nepal
Bahamians
95.9%
7TH GRADE
30.0/ 100
METRIC RATING
194th/ 347
METRIC RANK
95.7%
7TH GRADE
11.6/ 100
METRIC RATING
214th/ 347
METRIC RANK
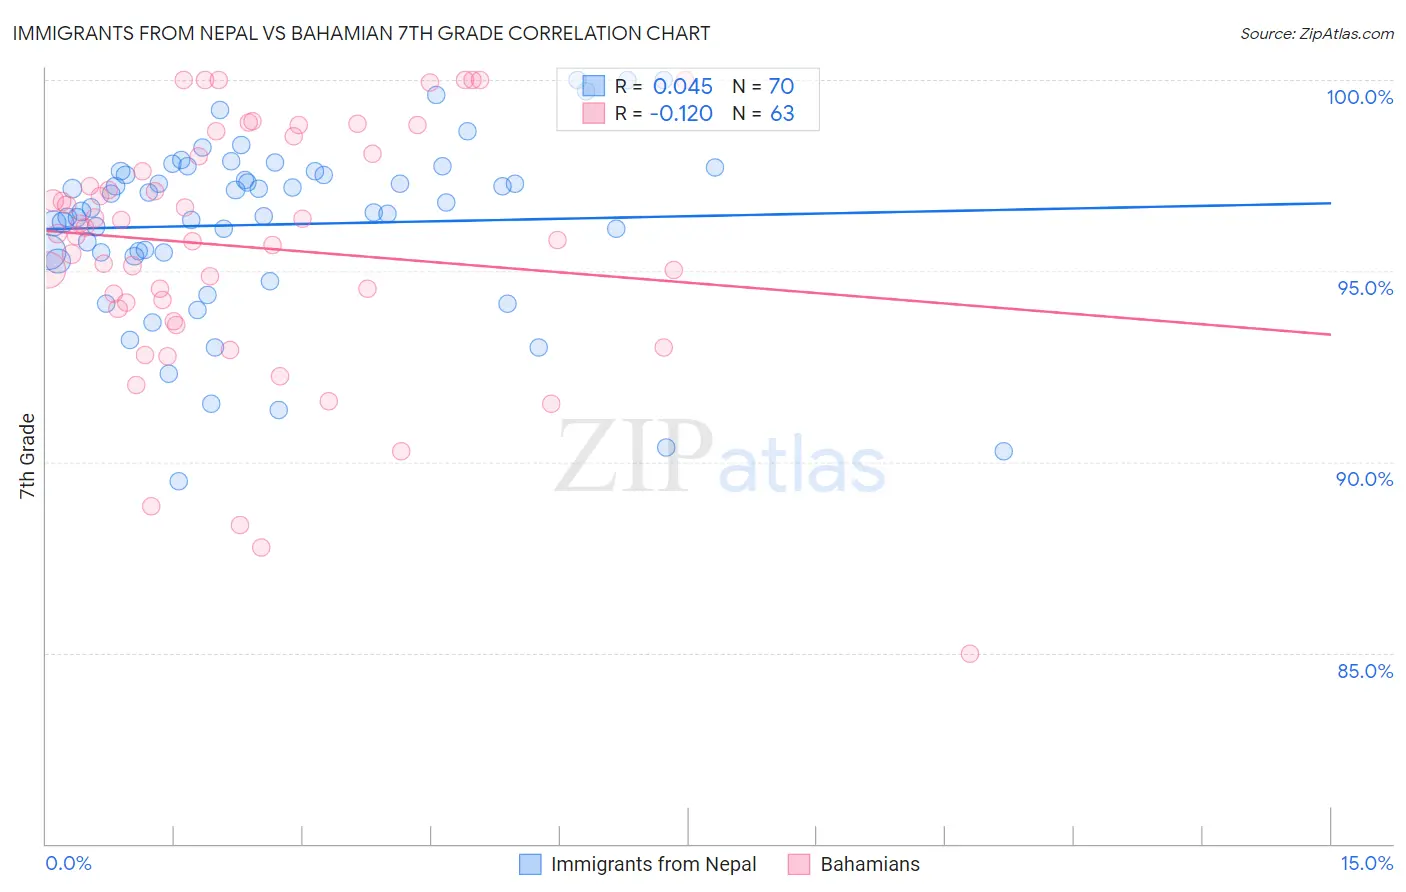
Immigrants from Nepal vs Bahamian 7th Grade Correlation Chart
The statistical analysis conducted on geographies consisting of 186,622,433 people shows no correlation between the proportion of Immigrants from Nepal and percentage of population with at least 7th grade education in the United States with a correlation coefficient (R) of 0.045 and weighted average of 95.9%. Similarly, the statistical analysis conducted on geographies consisting of 112,698,819 people shows a poor negative correlation between the proportion of Bahamians and percentage of population with at least 7th grade education in the United States with a correlation coefficient (R) of -0.120 and weighted average of 95.7%, a difference of 0.18%.
7th Grade Correlation Summary
| Measurement | Immigrants from Nepal | Bahamian |
| Minimum | 89.5% | 85.0% |
| Maximum | 100.0% | 100.0% |
| Range | 10.5% | 15.0% |
| Mean | 96.2% | 95.6% |
| Median | 96.6% | 96.0% |
| Interquartile 25% (IQ1) | 95.5% | 94.0% |
| Interquartile 75% (IQ3) | 97.6% | 98.1% |
| Interquartile Range (IQR) | 2.1% | 4.1% |
| Standard Deviation (Sample) | 2.3% | 3.3% |
| Standard Deviation (Population) | 2.3% | 3.3% |
Demographics Similar to Immigrants from Nepal and Bahamians by 7th Grade
In terms of 7th grade, the demographic groups most similar to Immigrants from Nepal are Sudanese (95.9%, a difference of 0.010%), Apache (95.9%, a difference of 0.020%), Immigrants from Zaire (95.9%, a difference of 0.020%), Paraguayan (95.9%, a difference of 0.040%), and Guamanian/Chamorro (95.9%, a difference of 0.050%). Similarly, the demographic groups most similar to Bahamians are Immigrants from Morocco (95.8%, a difference of 0.010%), Immigrants from Lebanon (95.8%, a difference of 0.020%), Portuguese (95.8%, a difference of 0.030%), Dutch West Indian (95.8%, a difference of 0.060%), and Hawaiian (95.8%, a difference of 0.060%).
| Demographics | Rating | Rank | 7th Grade |
| Immigrants | Nepal | 30.0 /100 | #194 | Fair 95.9% |
| Sudanese | 28.1 /100 | #195 | Fair 95.9% |
| Apache | 27.6 /100 | #196 | Fair 95.9% |
| Immigrants | Zaire | 26.7 /100 | #197 | Fair 95.9% |
| Paraguayans | 24.8 /100 | #198 | Fair 95.9% |
| Guamanians/Chamorros | 23.5 /100 | #199 | Fair 95.9% |
| Argentineans | 23.2 /100 | #200 | Fair 95.9% |
| Immigrants | Argentina | 21.9 /100 | #201 | Fair 95.9% |
| Immigrants | Northern Africa | 21.4 /100 | #202 | Fair 95.8% |
| Comanche | 21.1 /100 | #203 | Fair 95.8% |
| Assyrians/Chaldeans/Syriacs | 20.5 /100 | #204 | Fair 95.8% |
| Moroccans | 18.9 /100 | #205 | Poor 95.8% |
| Africans | 17.6 /100 | #206 | Poor 95.8% |
| Navajo | 17.0 /100 | #207 | Poor 95.8% |
| Immigrants | Sudan | 17.0 /100 | #208 | Poor 95.8% |
| Dutch West Indians | 16.1 /100 | #209 | Poor 95.8% |
| Hawaiians | 16.0 /100 | #210 | Poor 95.8% |
| Portuguese | 13.6 /100 | #211 | Poor 95.8% |
| Immigrants | Lebanon | 13.0 /100 | #212 | Poor 95.8% |
| Immigrants | Morocco | 12.6 /100 | #213 | Poor 95.8% |
| Bahamians | 11.6 /100 | #214 | Poor 95.7% |