Immigrants from Morocco vs Native Hawaiian 10th Grade
COMPARE
Immigrants from Morocco
Native Hawaiian
10th Grade
10th Grade Comparison
Immigrants from Morocco
Native Hawaiians
93.5%
10TH GRADE
26.9/ 100
METRIC RATING
194th/ 347
METRIC RANK
95.0%
10TH GRADE
99.7/ 100
METRIC RATING
64th/ 347
METRIC RANK
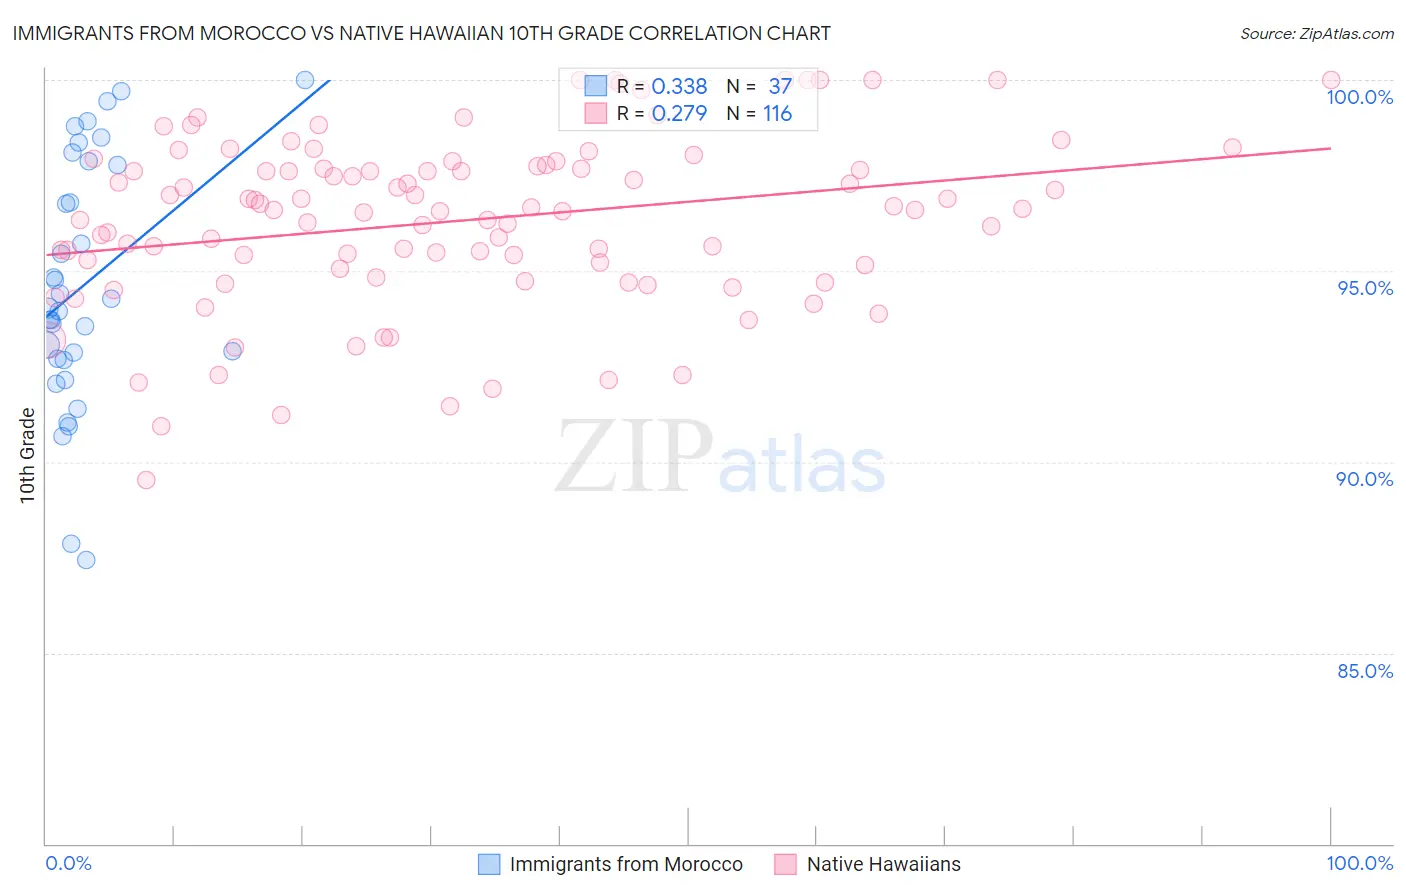
Immigrants from Morocco vs Native Hawaiian 10th Grade Correlation Chart
The statistical analysis conducted on geographies consisting of 178,912,438 people shows a mild positive correlation between the proportion of Immigrants from Morocco and percentage of population with at least 10th grade education in the United States with a correlation coefficient (R) of 0.338 and weighted average of 93.5%. Similarly, the statistical analysis conducted on geographies consisting of 332,119,254 people shows a weak positive correlation between the proportion of Native Hawaiians and percentage of population with at least 10th grade education in the United States with a correlation coefficient (R) of 0.279 and weighted average of 95.0%, a difference of 1.6%.
10th Grade Correlation Summary
| Measurement | Immigrants from Morocco | Native Hawaiian |
| Minimum | 87.4% | 89.5% |
| Maximum | 100.0% | 100.0% |
| Range | 12.6% | 10.5% |
| Mean | 94.6% | 96.3% |
| Median | 94.0% | 96.6% |
| Interquartile 25% (IQ1) | 92.7% | 95.1% |
| Interquartile 75% (IQ3) | 97.8% | 97.7% |
| Interquartile Range (IQR) | 5.1% | 2.6% |
| Standard Deviation (Sample) | 3.2% | 2.2% |
| Standard Deviation (Population) | 3.2% | 2.2% |
Similar Demographics by 10th Grade
Demographics Similar to Immigrants from Morocco by 10th Grade
In terms of 10th grade, the demographic groups most similar to Immigrants from Morocco are Cheyenne (93.5%, a difference of 0.0%), Immigrants from Malaysia (93.5%, a difference of 0.010%), Panamanian (93.5%, a difference of 0.010%), Moroccan (93.5%, a difference of 0.020%), and Pueblo (93.5%, a difference of 0.040%).
| Demographics | Rating | Rank | 10th Grade |
| Liberians | 34.7 /100 | #187 | Fair 93.6% |
| Marshallese | 33.2 /100 | #188 | Fair 93.6% |
| Immigrants | Pakistan | 32.5 /100 | #189 | Fair 93.6% |
| Laotians | 32.1 /100 | #190 | Fair 93.6% |
| Yup'ik | 31.1 /100 | #191 | Fair 93.6% |
| Immigrants | Malaysia | 28.0 /100 | #192 | Fair 93.5% |
| Panamanians | 28.0 /100 | #193 | Fair 93.5% |
| Immigrants | Morocco | 26.9 /100 | #194 | Fair 93.5% |
| Cheyenne | 26.8 /100 | #195 | Fair 93.5% |
| Moroccans | 25.3 /100 | #196 | Fair 93.5% |
| Pueblo | 23.9 /100 | #197 | Fair 93.5% |
| Immigrants | Micronesia | 23.2 /100 | #198 | Fair 93.5% |
| Asians | 23.0 /100 | #199 | Fair 93.5% |
| Hopi | 22.2 /100 | #200 | Fair 93.5% |
| Hawaiians | 21.8 /100 | #201 | Fair 93.5% |
Demographics Similar to Native Hawaiians by 10th Grade
In terms of 10th grade, the demographic groups most similar to Native Hawaiians are Thai (95.0%, a difference of 0.010%), Immigrants from Singapore (95.0%, a difference of 0.010%), Turkish (95.0%, a difference of 0.010%), Cypriot (95.0%, a difference of 0.020%), and Chippewa (95.0%, a difference of 0.020%).
| Demographics | Rating | Rank | 10th Grade |
| Ukrainians | 99.8 /100 | #57 | Exceptional 95.0% |
| Aleuts | 99.8 /100 | #58 | Exceptional 95.0% |
| Celtics | 99.8 /100 | #59 | Exceptional 95.0% |
| Cypriots | 99.8 /100 | #60 | Exceptional 95.0% |
| Chippewa | 99.8 /100 | #61 | Exceptional 95.0% |
| Thais | 99.8 /100 | #62 | Exceptional 95.0% |
| Immigrants | Singapore | 99.8 /100 | #63 | Exceptional 95.0% |
| Native Hawaiians | 99.7 /100 | #64 | Exceptional 95.0% |
| Turks | 99.7 /100 | #65 | Exceptional 95.0% |
| Immigrants | Australia | 99.7 /100 | #66 | Exceptional 94.9% |
| Immigrants | Netherlands | 99.7 /100 | #67 | Exceptional 94.9% |
| Immigrants | Belgium | 99.7 /100 | #68 | Exceptional 94.9% |
| Immigrants | England | 99.6 /100 | #69 | Exceptional 94.9% |
| Zimbabweans | 99.6 /100 | #70 | Exceptional 94.9% |
| Alaska Natives | 99.6 /100 | #71 | Exceptional 94.9% |