Immigrants from Morocco vs Immigrants from Germany 2nd Grade
COMPARE
Immigrants from Morocco
Immigrants from Germany
2nd Grade
2nd Grade Comparison
Immigrants from Morocco
Immigrants from Germany
97.6%
2ND GRADE
5.0/ 100
METRIC RATING
220th/ 347
METRIC RANK
98.2%
2ND GRADE
98.6/ 100
METRIC RATING
94th/ 347
METRIC RANK
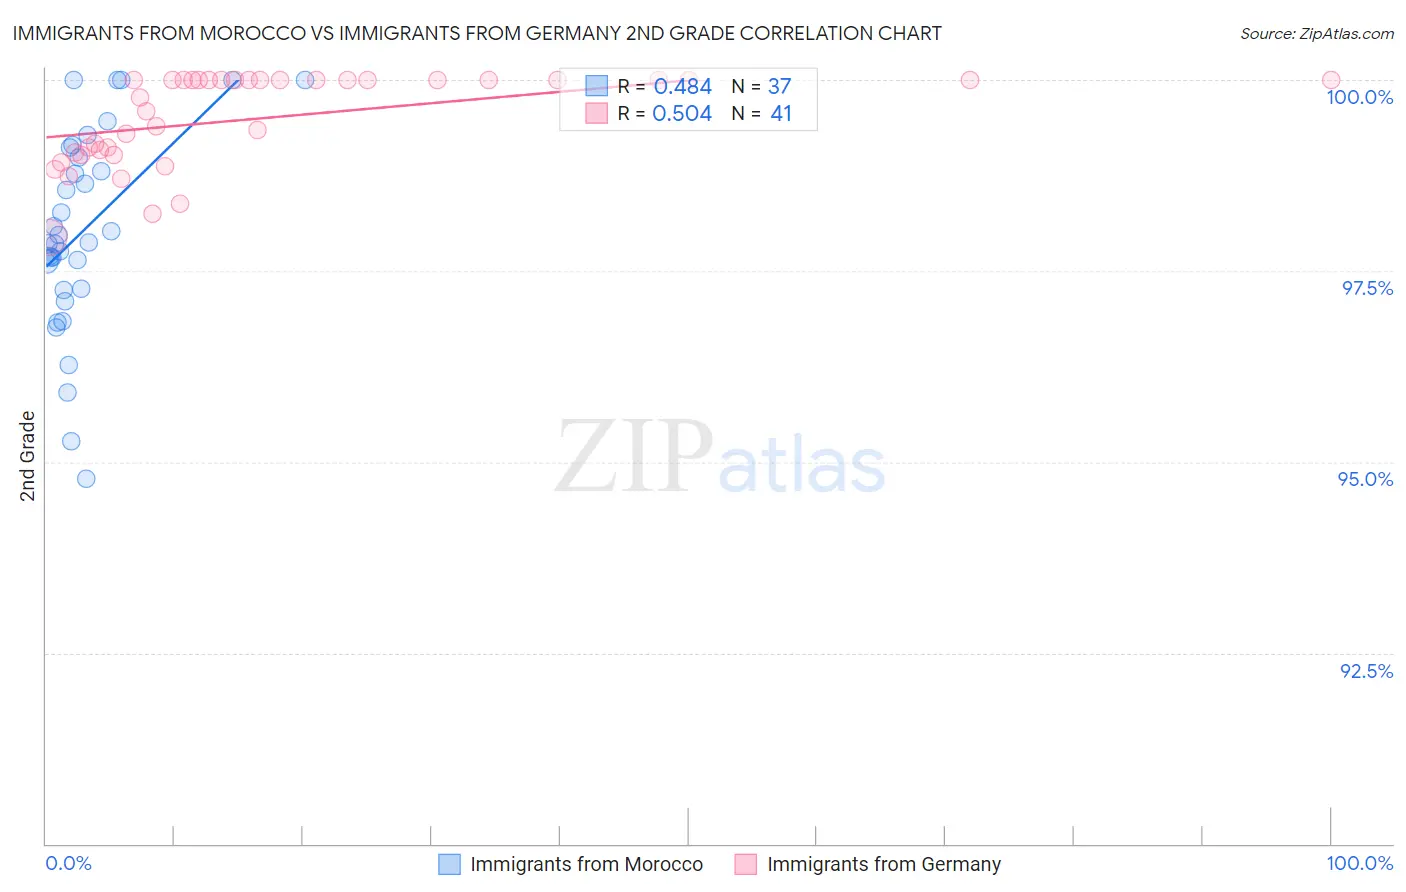
Immigrants from Morocco vs Immigrants from Germany 2nd Grade Correlation Chart
The statistical analysis conducted on geographies consisting of 178,912,438 people shows a moderate positive correlation between the proportion of Immigrants from Morocco and percentage of population with at least 2nd grade education in the United States with a correlation coefficient (R) of 0.484 and weighted average of 97.6%. Similarly, the statistical analysis conducted on geographies consisting of 463,886,643 people shows a substantial positive correlation between the proportion of Immigrants from Germany and percentage of population with at least 2nd grade education in the United States with a correlation coefficient (R) of 0.504 and weighted average of 98.2%, a difference of 0.57%.
2nd Grade Correlation Summary
| Measurement | Immigrants from Morocco | Immigrants from Germany |
| Minimum | 94.8% | 97.9% |
| Maximum | 100.0% | 100.0% |
| Range | 5.2% | 2.1% |
| Mean | 98.0% | 99.5% |
| Median | 97.9% | 100.0% |
| Interquartile 25% (IQ1) | 97.3% | 99.0% |
| Interquartile 75% (IQ3) | 99.0% | 100.0% |
| Interquartile Range (IQR) | 1.8% | 0.96% |
| Standard Deviation (Sample) | 1.3% | 0.60% |
| Standard Deviation (Population) | 1.3% | 0.59% |
Similar Demographics by 2nd Grade
Demographics Similar to Immigrants from Morocco by 2nd Grade
In terms of 2nd grade, the demographic groups most similar to Immigrants from Morocco are Immigrants from Panama (97.6%, a difference of 0.0%), Sudanese (97.7%, a difference of 0.010%), Iraqi (97.6%, a difference of 0.010%), Immigrants from Sudan (97.6%, a difference of 0.010%), and Sierra Leonean (97.6%, a difference of 0.010%).
| Demographics | Rating | Rank | 2nd Grade |
| Moroccans | 8.2 /100 | #213 | Tragic 97.7% |
| Samoans | 7.1 /100 | #214 | Tragic 97.7% |
| Bahamians | 6.8 /100 | #215 | Tragic 97.7% |
| South American Indians | 6.7 /100 | #216 | Tragic 97.7% |
| Uruguayans | 6.2 /100 | #217 | Tragic 97.7% |
| Sudanese | 5.7 /100 | #218 | Tragic 97.7% |
| Immigrants | Panama | 5.1 /100 | #219 | Tragic 97.6% |
| Immigrants | Morocco | 5.0 /100 | #220 | Tragic 97.6% |
| Iraqis | 4.6 /100 | #221 | Tragic 97.6% |
| Immigrants | Sudan | 4.5 /100 | #222 | Tragic 97.6% |
| Sierra Leoneans | 4.3 /100 | #223 | Tragic 97.6% |
| Immigrants | Zaire | 4.3 /100 | #224 | Tragic 97.6% |
| Tongans | 4.3 /100 | #225 | Tragic 97.6% |
| Immigrants | Syria | 4.0 /100 | #226 | Tragic 97.6% |
| Immigrants | Nepal | 4.0 /100 | #227 | Tragic 97.6% |
Demographics Similar to Immigrants from Germany by 2nd Grade
In terms of 2nd grade, the demographic groups most similar to Immigrants from Germany are South African (98.2%, a difference of 0.0%), Immigrants from India (98.2%, a difference of 0.010%), Cypriot (98.2%, a difference of 0.010%), Macedonian (98.2%, a difference of 0.020%), and Ukrainian (98.2%, a difference of 0.020%).
| Demographics | Rating | Rank | 2nd Grade |
| Immigrants | Denmark | 99.0 /100 | #87 | Exceptional 98.2% |
| Macedonians | 99.0 /100 | #88 | Exceptional 98.2% |
| Ukrainians | 98.9 /100 | #89 | Exceptional 98.2% |
| Zimbabweans | 98.8 /100 | #90 | Exceptional 98.2% |
| Immigrants | Western Europe | 98.8 /100 | #91 | Exceptional 98.2% |
| Immigrants | South Africa | 98.8 /100 | #92 | Exceptional 98.2% |
| Immigrants | India | 98.8 /100 | #93 | Exceptional 98.2% |
| Immigrants | Germany | 98.6 /100 | #94 | Exceptional 98.2% |
| South Africans | 98.6 /100 | #95 | Exceptional 98.2% |
| Cypriots | 98.4 /100 | #96 | Exceptional 98.2% |
| Choctaw | 98.3 /100 | #97 | Exceptional 98.2% |
| Immigrants | Nonimmigrants | 98.3 /100 | #98 | Exceptional 98.2% |
| Immigrants | Ireland | 98.0 /100 | #99 | Exceptional 98.2% |
| Romanians | 98.0 /100 | #100 | Exceptional 98.2% |
| Puget Sound Salish | 98.0 /100 | #101 | Exceptional 98.2% |