Immigrants from Moldova vs Native Hawaiian 5th Grade
COMPARE
Immigrants from Moldova
Native Hawaiian
5th Grade
5th Grade Comparison
Immigrants from Moldova
Native Hawaiians
97.5%
5TH GRADE
87.5/ 100
METRIC RATING
136th/ 347
METRIC RANK
98.0%
5TH GRADE
99.9/ 100
METRIC RATING
47th/ 347
METRIC RANK
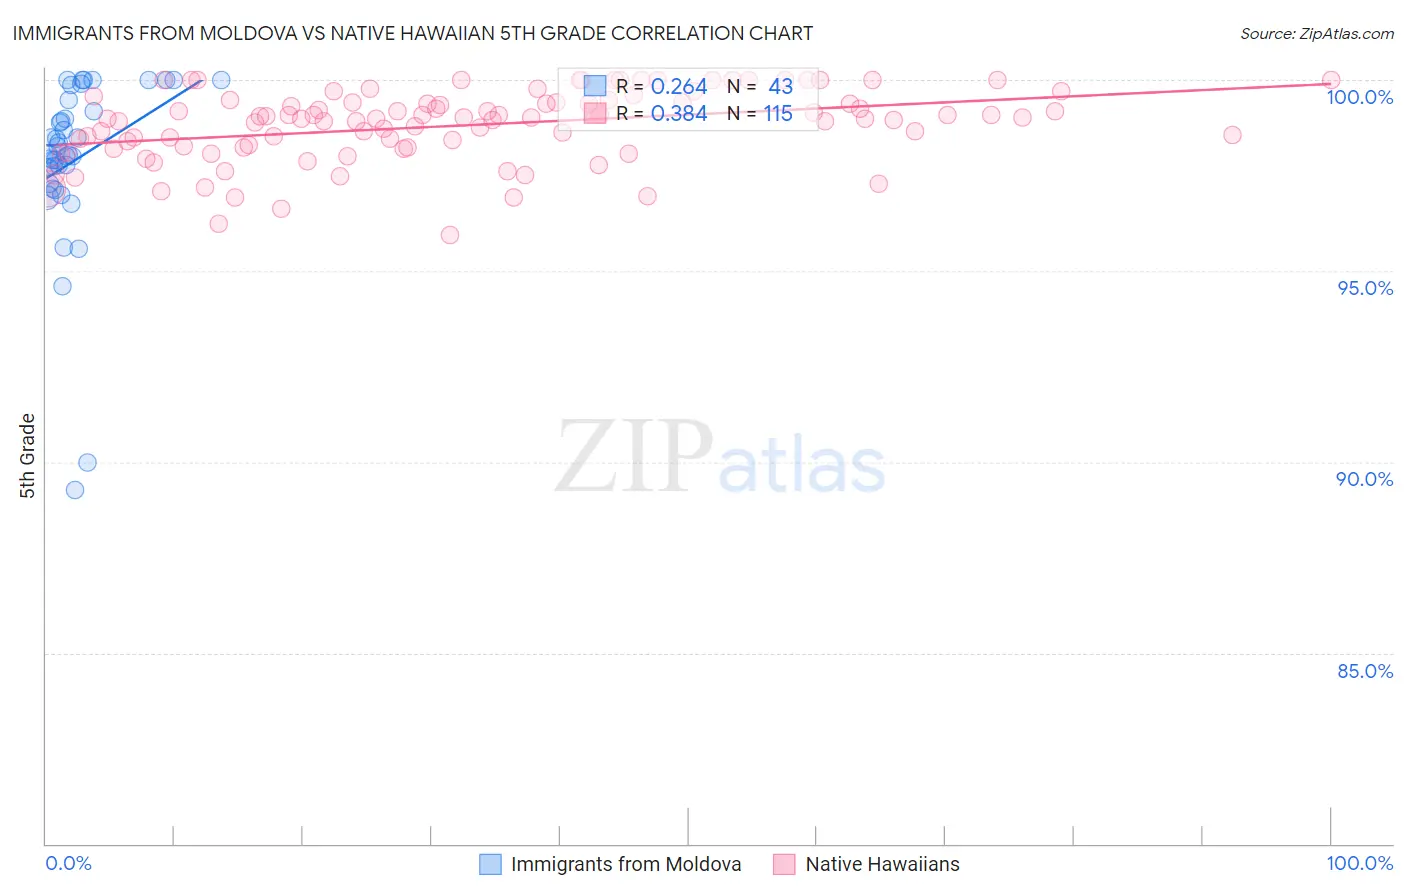
Immigrants from Moldova vs Native Hawaiian 5th Grade Correlation Chart
The statistical analysis conducted on geographies consisting of 124,398,501 people shows a weak positive correlation between the proportion of Immigrants from Moldova and percentage of population with at least 5th grade education in the United States with a correlation coefficient (R) of 0.264 and weighted average of 97.5%. Similarly, the statistical analysis conducted on geographies consisting of 332,113,170 people shows a mild positive correlation between the proportion of Native Hawaiians and percentage of population with at least 5th grade education in the United States with a correlation coefficient (R) of 0.384 and weighted average of 98.0%, a difference of 0.48%.
5th Grade Correlation Summary
| Measurement | Immigrants from Moldova | Native Hawaiian |
| Minimum | 89.3% | 95.9% |
| Maximum | 100.0% | 100.0% |
| Range | 10.7% | 4.1% |
| Mean | 97.9% | 98.8% |
| Median | 98.1% | 99.0% |
| Interquartile 25% (IQ1) | 97.3% | 98.2% |
| Interquartile 75% (IQ3) | 99.5% | 99.4% |
| Interquartile Range (IQR) | 2.2% | 1.2% |
| Standard Deviation (Sample) | 2.3% | 0.93% |
| Standard Deviation (Population) | 2.2% | 0.93% |
Similar Demographics by 5th Grade
Demographics Similar to Immigrants from Moldova by 5th Grade
In terms of 5th grade, the demographic groups most similar to Immigrants from Moldova are Filipino (97.5%, a difference of 0.010%), Blackfeet (97.5%, a difference of 0.010%), Immigrants from Turkey (97.5%, a difference of 0.010%), Burmese (97.5%, a difference of 0.010%), and Palestinian (97.5%, a difference of 0.020%).
| Demographics | Rating | Rank | 5th Grade |
| Immigrants | Europe | 91.9 /100 | #129 | Exceptional 97.6% |
| Immigrants | Romania | 91.6 /100 | #130 | Exceptional 97.6% |
| Pima | 91.2 /100 | #131 | Exceptional 97.6% |
| Immigrants | Kuwait | 90.4 /100 | #132 | Exceptional 97.6% |
| Cambodians | 90.2 /100 | #133 | Exceptional 97.6% |
| Immigrants | Hungary | 90.1 /100 | #134 | Exceptional 97.6% |
| Palestinians | 89.3 /100 | #135 | Excellent 97.5% |
| Immigrants | Moldova | 87.5 /100 | #136 | Excellent 97.5% |
| Filipinos | 86.8 /100 | #137 | Excellent 97.5% |
| Blackfeet | 86.8 /100 | #138 | Excellent 97.5% |
| Immigrants | Turkey | 86.7 /100 | #139 | Excellent 97.5% |
| Burmese | 86.1 /100 | #140 | Excellent 97.5% |
| Seminole | 85.8 /100 | #141 | Excellent 97.5% |
| Israelis | 85.5 /100 | #142 | Excellent 97.5% |
| Immigrants | North Macedonia | 85.4 /100 | #143 | Excellent 97.5% |
Demographics Similar to Native Hawaiians by 5th Grade
In terms of 5th grade, the demographic groups most similar to Native Hawaiians are Czechoslovakian (98.0%, a difference of 0.010%), Arapaho (98.0%, a difference of 0.010%), Bulgarian (98.0%, a difference of 0.010%), Aleut (98.0%, a difference of 0.020%), and Estonian (98.0%, a difference of 0.020%).
| Demographics | Rating | Rank | 5th Grade |
| Eastern Europeans | 99.9 /100 | #40 | Exceptional 98.1% |
| Hungarians | 99.9 /100 | #41 | Exceptional 98.0% |
| Northern Europeans | 99.9 /100 | #42 | Exceptional 98.0% |
| Ottawa | 99.9 /100 | #43 | Exceptional 98.0% |
| Aleuts | 99.9 /100 | #44 | Exceptional 98.0% |
| Czechoslovakians | 99.9 /100 | #45 | Exceptional 98.0% |
| Arapaho | 99.9 /100 | #46 | Exceptional 98.0% |
| Native Hawaiians | 99.9 /100 | #47 | Exceptional 98.0% |
| Bulgarians | 99.8 /100 | #48 | Exceptional 98.0% |
| Estonians | 99.8 /100 | #49 | Exceptional 98.0% |
| Immigrants | Scotland | 99.8 /100 | #50 | Exceptional 98.0% |
| Celtics | 99.8 /100 | #51 | Exceptional 98.0% |
| Maltese | 99.8 /100 | #52 | Exceptional 98.0% |
| Slavs | 99.8 /100 | #53 | Exceptional 98.0% |
| Australians | 99.8 /100 | #54 | Exceptional 98.0% |