Immigrants from Moldova vs Immigrants from Burma/Myanmar 9th Grade
COMPARE
Immigrants from Moldova
Immigrants from Burma/Myanmar
9th Grade
9th Grade Comparison
Immigrants from Moldova
Immigrants from Burma/Myanmar
95.5%
9TH GRADE
97.9/ 100
METRIC RATING
101st/ 347
METRIC RANK
93.1%
9TH GRADE
0.0/ 100
METRIC RATING
295th/ 347
METRIC RANK
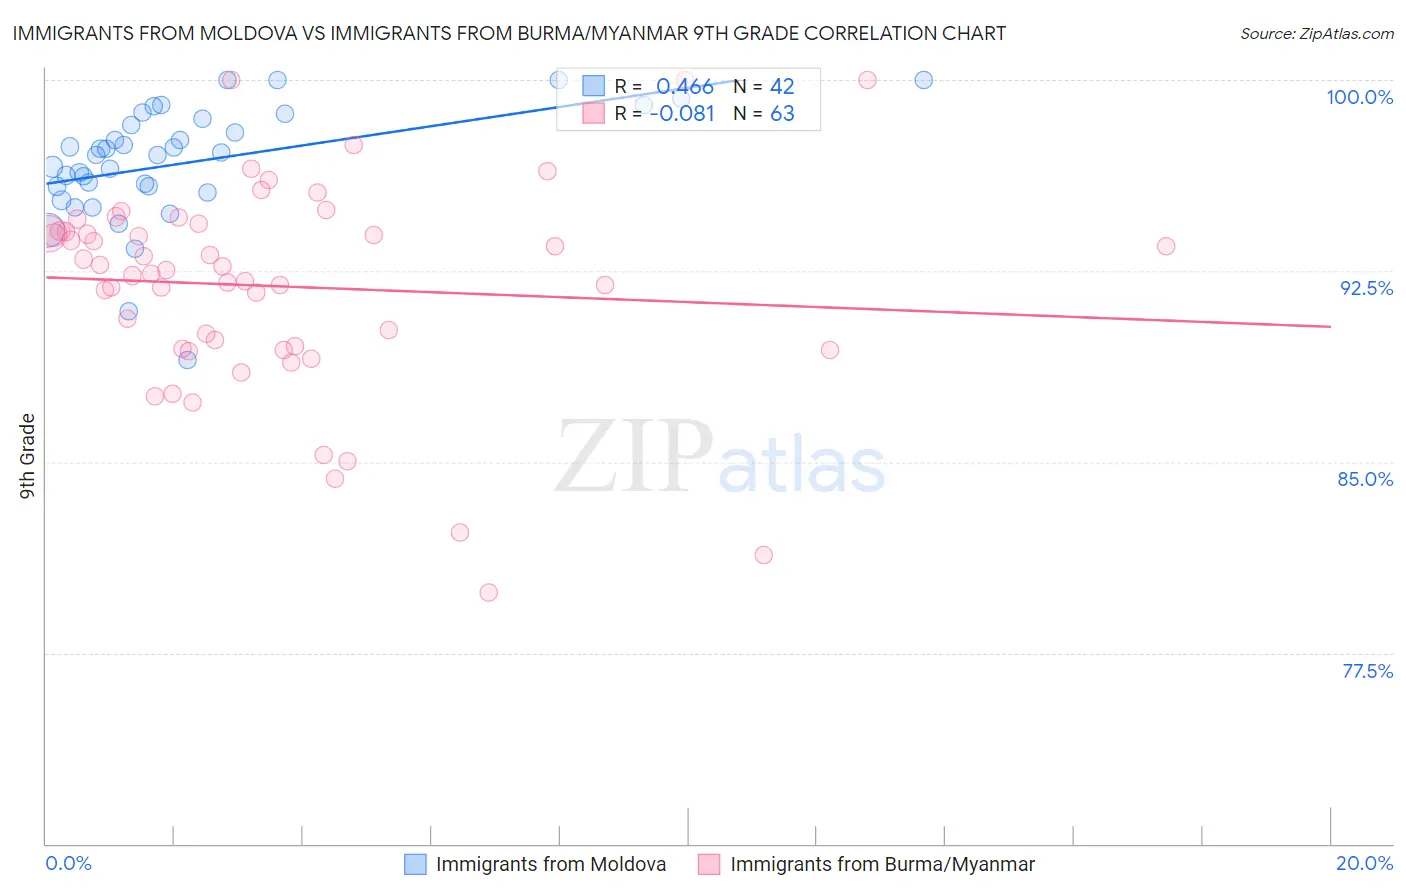
Immigrants from Moldova vs Immigrants from Burma/Myanmar 9th Grade Correlation Chart
The statistical analysis conducted on geographies consisting of 124,396,843 people shows a moderate positive correlation between the proportion of Immigrants from Moldova and percentage of population with at least 9th grade education in the United States with a correlation coefficient (R) of 0.466 and weighted average of 95.5%. Similarly, the statistical analysis conducted on geographies consisting of 172,345,696 people shows a slight negative correlation between the proportion of Immigrants from Burma/Myanmar and percentage of population with at least 9th grade education in the United States with a correlation coefficient (R) of -0.081 and weighted average of 93.1%, a difference of 2.6%.
9th Grade Correlation Summary
| Measurement | Immigrants from Moldova | Immigrants from Burma/Myanmar |
| Minimum | 89.0% | 79.9% |
| Maximum | 100.0% | 100.0% |
| Range | 11.0% | 20.1% |
| Mean | 96.8% | 91.9% |
| Median | 97.1% | 92.5% |
| Interquartile 25% (IQ1) | 95.8% | 89.4% |
| Interquartile 75% (IQ3) | 98.5% | 94.1% |
| Interquartile Range (IQR) | 2.6% | 4.6% |
| Standard Deviation (Sample) | 2.3% | 4.1% |
| Standard Deviation (Population) | 2.3% | 4.1% |
Similar Demographics by 9th Grade
Demographics Similar to Immigrants from Moldova by 9th Grade
In terms of 9th grade, the demographic groups most similar to Immigrants from Moldova are Immigrants from Switzerland (95.5%, a difference of 0.010%), Lebanese (95.6%, a difference of 0.020%), Potawatomi (95.5%, a difference of 0.020%), Menominee (95.6%, a difference of 0.040%), and Syrian (95.5%, a difference of 0.040%).
| Demographics | Rating | Rank | 9th Grade |
| Immigrants | Latvia | 98.7 /100 | #94 | Exceptional 95.6% |
| Americans | 98.5 /100 | #95 | Exceptional 95.6% |
| Filipinos | 98.5 /100 | #96 | Exceptional 95.6% |
| Delaware | 98.4 /100 | #97 | Exceptional 95.6% |
| Immigrants | Japan | 98.4 /100 | #98 | Exceptional 95.6% |
| Menominee | 98.3 /100 | #99 | Exceptional 95.6% |
| Lebanese | 98.1 /100 | #100 | Exceptional 95.6% |
| Immigrants | Moldova | 97.9 /100 | #101 | Exceptional 95.5% |
| Immigrants | Switzerland | 97.7 /100 | #102 | Exceptional 95.5% |
| Potawatomi | 97.7 /100 | #103 | Exceptional 95.5% |
| Syrians | 97.4 /100 | #104 | Exceptional 95.5% |
| Immigrants | France | 97.4 /100 | #105 | Exceptional 95.5% |
| Immigrants | Norway | 97.1 /100 | #106 | Exceptional 95.5% |
| Immigrants | Zimbabwe | 96.9 /100 | #107 | Exceptional 95.5% |
| Chickasaw | 96.8 /100 | #108 | Exceptional 95.5% |
Demographics Similar to Immigrants from Burma/Myanmar by 9th Grade
In terms of 9th grade, the demographic groups most similar to Immigrants from Burma/Myanmar are Indonesian (93.1%, a difference of 0.0%), Sri Lankan (93.2%, a difference of 0.020%), Cuban (93.2%, a difference of 0.020%), Fijian (93.1%, a difference of 0.030%), and Immigrants from Laos (93.2%, a difference of 0.040%).
| Demographics | Rating | Rank | 9th Grade |
| Immigrants | South Eastern Asia | 0.0 /100 | #288 | Tragic 93.3% |
| Immigrants | West Indies | 0.0 /100 | #289 | Tragic 93.3% |
| Pennsylvania Germans | 0.0 /100 | #290 | Tragic 93.3% |
| British West Indians | 0.0 /100 | #291 | Tragic 93.2% |
| Immigrants | Laos | 0.0 /100 | #292 | Tragic 93.2% |
| Sri Lankans | 0.0 /100 | #293 | Tragic 93.2% |
| Cubans | 0.0 /100 | #294 | Tragic 93.2% |
| Immigrants | Burma/Myanmar | 0.0 /100 | #295 | Tragic 93.1% |
| Indonesians | 0.0 /100 | #296 | Tragic 93.1% |
| Fijians | 0.0 /100 | #297 | Tragic 93.1% |
| Haitians | 0.0 /100 | #298 | Tragic 93.1% |
| Immigrants | Grenada | 0.0 /100 | #299 | Tragic 93.0% |
| Yaqui | 0.0 /100 | #300 | Tragic 92.9% |
| Immigrants | Haiti | 0.0 /100 | #301 | Tragic 92.7% |
| Immigrants | Dominica | 0.0 /100 | #302 | Tragic 92.7% |