Immigrants from Middle Africa vs Pakistani 4th Grade
COMPARE
Immigrants from Middle Africa
Pakistani
4th Grade
4th Grade Comparison
Immigrants from Middle Africa
Pakistanis
97.1%
4TH GRADE
0.8/ 100
METRIC RATING
254th/ 347
METRIC RANK
97.5%
4TH GRADE
36.2/ 100
METRIC RATING
184th/ 347
METRIC RANK
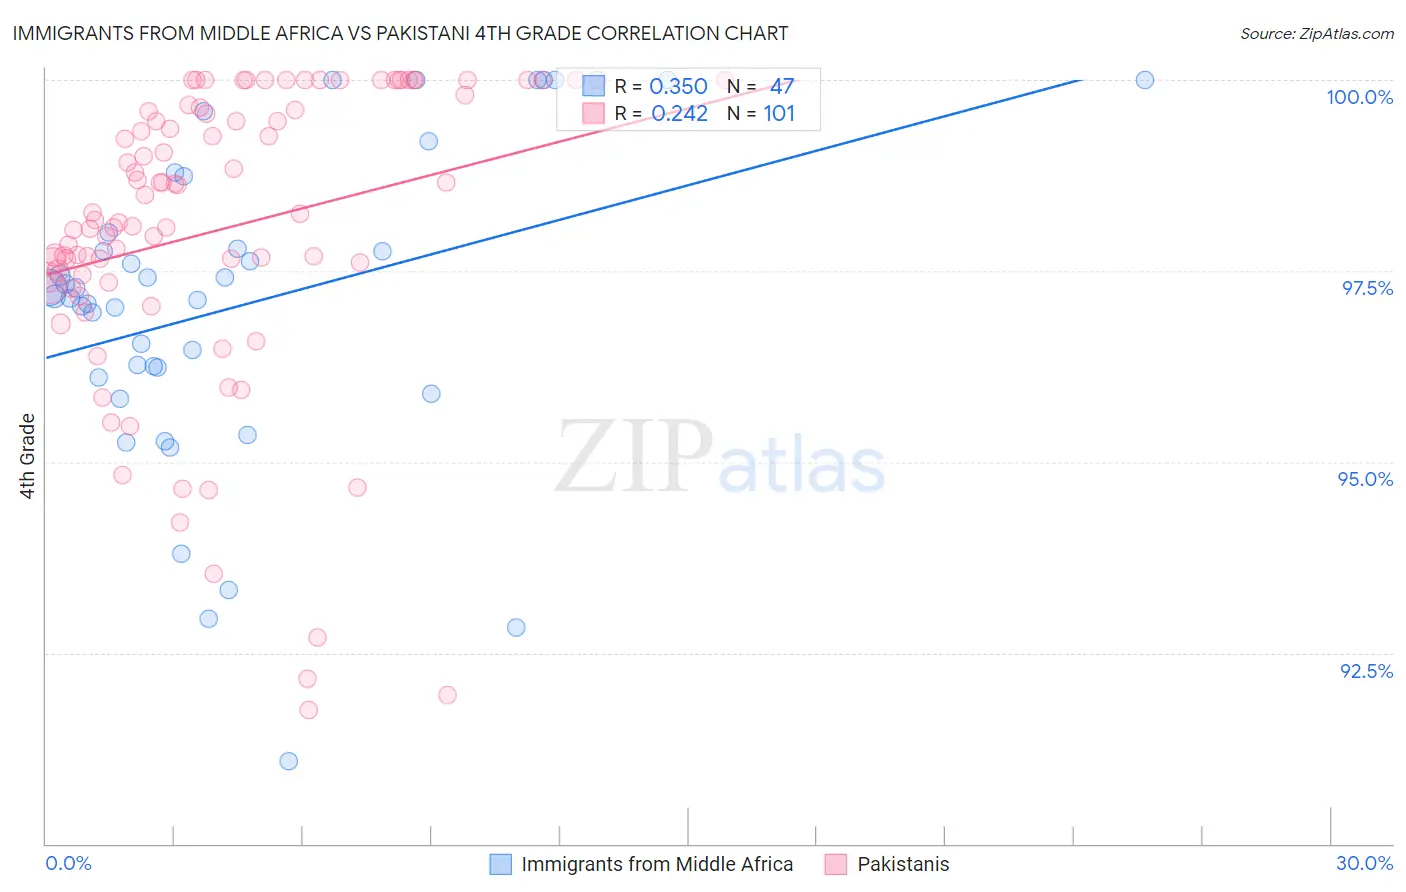
Immigrants from Middle Africa vs Pakistani 4th Grade Correlation Chart
The statistical analysis conducted on geographies consisting of 202,721,852 people shows a mild positive correlation between the proportion of Immigrants from Middle Africa and percentage of population with at least 4th grade education in the United States with a correlation coefficient (R) of 0.350 and weighted average of 97.1%. Similarly, the statistical analysis conducted on geographies consisting of 335,355,370 people shows a weak positive correlation between the proportion of Pakistanis and percentage of population with at least 4th grade education in the United States with a correlation coefficient (R) of 0.242 and weighted average of 97.5%, a difference of 0.40%.
4th Grade Correlation Summary
| Measurement | Immigrants from Middle Africa | Pakistani |
| Minimum | 91.1% | 91.8% |
| Maximum | 100.0% | 100.0% |
| Range | 8.9% | 8.2% |
| Mean | 97.0% | 98.0% |
| Median | 97.2% | 98.2% |
| Interquartile 25% (IQ1) | 96.1% | 97.4% |
| Interquartile 75% (IQ3) | 98.0% | 99.7% |
| Interquartile Range (IQR) | 1.9% | 2.3% |
| Standard Deviation (Sample) | 2.1% | 2.0% |
| Standard Deviation (Population) | 2.0% | 2.0% |
Similar Demographics by 4th Grade
Demographics Similar to Immigrants from Middle Africa by 4th Grade
In terms of 4th grade, the demographic groups most similar to Immigrants from Middle Africa are South American (97.1%, a difference of 0.0%), Jamaican (97.1%, a difference of 0.0%), Immigrants from Liberia (97.1%, a difference of 0.0%), Immigrants from Senegal (97.1%, a difference of 0.010%), and Peruvian (97.1%, a difference of 0.010%).
| Demographics | Rating | Rank | 4th Grade |
| Ethiopians | 1.2 /100 | #247 | Tragic 97.1% |
| Immigrants | Asia | 1.2 /100 | #248 | Tragic 97.1% |
| Immigrants | Africa | 1.0 /100 | #249 | Tragic 97.1% |
| Immigrants | Senegal | 0.9 /100 | #250 | Tragic 97.1% |
| South Americans | 0.8 /100 | #251 | Tragic 97.1% |
| Jamaicans | 0.8 /100 | #252 | Tragic 97.1% |
| Immigrants | Liberia | 0.8 /100 | #253 | Tragic 97.1% |
| Immigrants | Middle Africa | 0.8 /100 | #254 | Tragic 97.1% |
| Peruvians | 0.7 /100 | #255 | Tragic 97.1% |
| Bolivians | 0.7 /100 | #256 | Tragic 97.1% |
| Immigrants | Congo | 0.5 /100 | #257 | Tragic 97.0% |
| Immigrants | Colombia | 0.5 /100 | #258 | Tragic 97.0% |
| Immigrants | Ethiopia | 0.4 /100 | #259 | Tragic 97.0% |
| Immigrants | Sierra Leone | 0.4 /100 | #260 | Tragic 97.0% |
| Immigrants | South America | 0.4 /100 | #261 | Tragic 97.0% |
Demographics Similar to Pakistanis by 4th Grade
In terms of 4th grade, the demographic groups most similar to Pakistanis are Immigrants from Kenya (97.5%, a difference of 0.0%), Dutch West Indian (97.5%, a difference of 0.0%), Spanish American (97.5%, a difference of 0.010%), Argentinean (97.5%, a difference of 0.010%), and Mongolian (97.5%, a difference of 0.010%).
| Demographics | Rating | Rank | 4th Grade |
| Immigrants | Brazil | 46.1 /100 | #177 | Average 97.5% |
| Comanche | 45.3 /100 | #178 | Average 97.5% |
| Immigrants | Kazakhstan | 43.6 /100 | #179 | Average 97.5% |
| Immigrants | Venezuela | 42.7 /100 | #180 | Average 97.5% |
| Immigrants | Taiwan | 41.5 /100 | #181 | Average 97.5% |
| Spanish Americans | 39.3 /100 | #182 | Fair 97.5% |
| Argentineans | 39.0 /100 | #183 | Fair 97.5% |
| Pakistanis | 36.2 /100 | #184 | Fair 97.5% |
| Immigrants | Kenya | 35.8 /100 | #185 | Fair 97.5% |
| Dutch West Indians | 35.8 /100 | #186 | Fair 97.5% |
| Mongolians | 34.7 /100 | #187 | Fair 97.5% |
| Immigrants | Argentina | 34.6 /100 | #188 | Fair 97.5% |
| Panamanians | 31.9 /100 | #189 | Fair 97.4% |
| Blacks/African Americans | 31.1 /100 | #190 | Fair 97.4% |
| Navajo | 30.7 /100 | #191 | Fair 97.4% |