Immigrants from Middle Africa vs Crow 12th Grade, No Diploma
COMPARE
Immigrants from Middle Africa
Crow
12th Grade, No Diploma
12th Grade, No Diploma Comparison
Immigrants from Middle Africa
Crow
90.0%
12TH GRADE, NO DIPLOMA
1.7/ 100
METRIC RATING
241st/ 347
METRIC RANK
90.0%
12TH GRADE, NO DIPLOMA
1.5/ 100
METRIC RATING
243rd/ 347
METRIC RANK
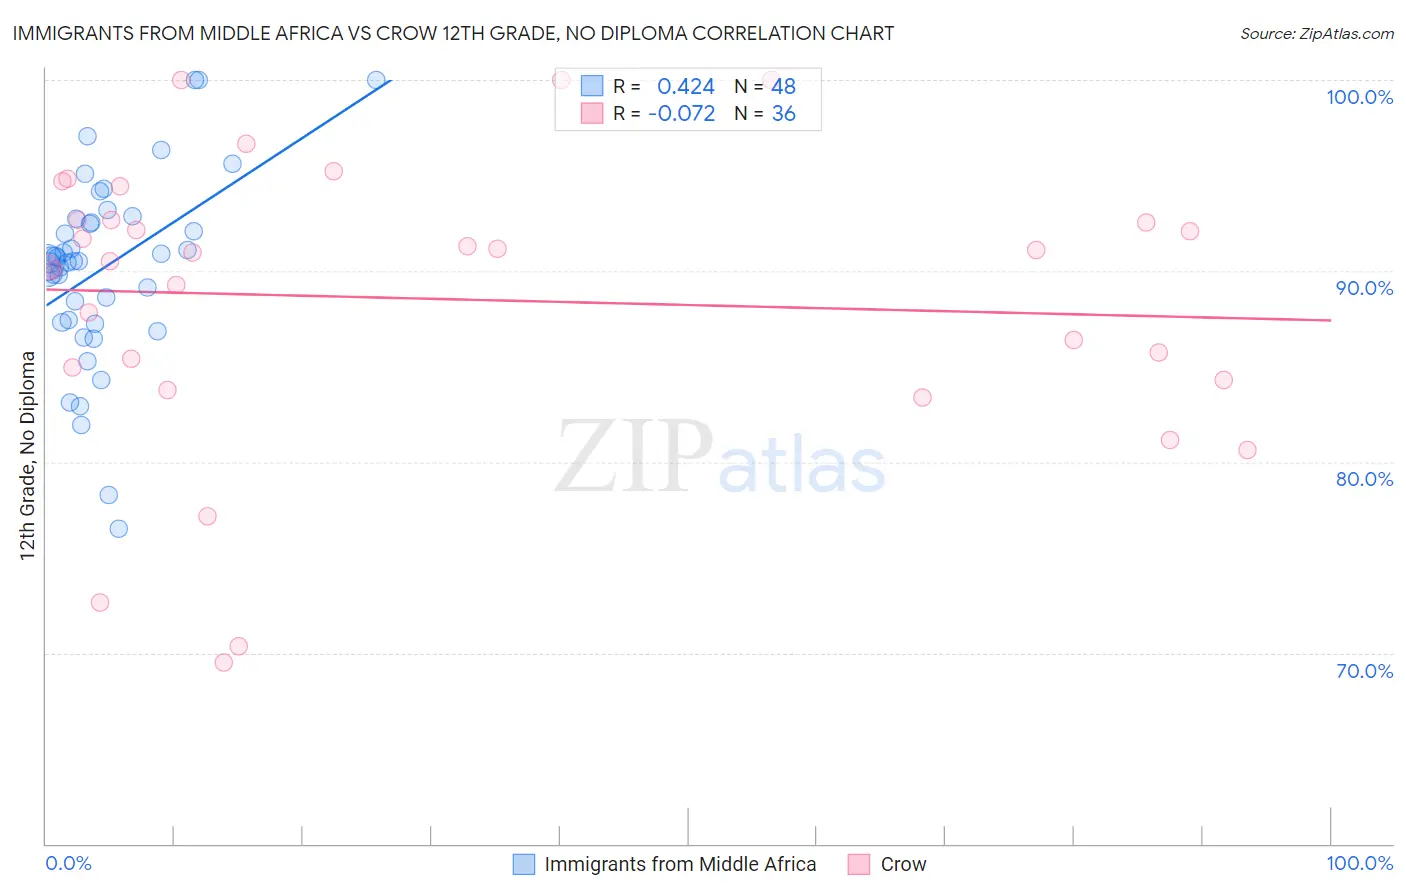
Immigrants from Middle Africa vs Crow 12th Grade, No Diploma Correlation Chart
The statistical analysis conducted on geographies consisting of 202,748,536 people shows a moderate positive correlation between the proportion of Immigrants from Middle Africa and percentage of population with at least 12th grade (no diploma) education in the United States with a correlation coefficient (R) of 0.424 and weighted average of 90.0%. Similarly, the statistical analysis conducted on geographies consisting of 59,209,980 people shows a slight negative correlation between the proportion of Crow and percentage of population with at least 12th grade (no diploma) education in the United States with a correlation coefficient (R) of -0.072 and weighted average of 90.0%, a difference of 0.030%.
12th Grade, No Diploma Correlation Summary
| Measurement | Immigrants from Middle Africa | Crow |
| Minimum | 76.5% | 69.5% |
| Maximum | 100.0% | 100.0% |
| Range | 23.5% | 30.5% |
| Mean | 90.2% | 88.5% |
| Median | 90.5% | 90.8% |
| Interquartile 25% (IQ1) | 87.4% | 84.6% |
| Interquartile 75% (IQ3) | 92.6% | 92.7% |
| Interquartile Range (IQR) | 5.3% | 8.1% |
| Standard Deviation (Sample) | 4.9% | 7.6% |
| Standard Deviation (Population) | 4.9% | 7.5% |
Demographics Similar to Immigrants from Middle Africa and Crow by 12th Grade, No Diploma
In terms of 12th grade, no diploma, the demographic groups most similar to Immigrants from Middle Africa are Kiowa (90.0%, a difference of 0.010%), Subsaharan African (90.1%, a difference of 0.030%), Immigrants from Costa Rica (90.0%, a difference of 0.030%), Taiwanese (90.0%, a difference of 0.040%), and Inupiat (90.1%, a difference of 0.050%). Similarly, the demographic groups most similar to Crow are Taiwanese (90.0%, a difference of 0.0%), Immigrants from Costa Rica (90.0%, a difference of 0.010%), Kiowa (90.0%, a difference of 0.040%), Immigrants from Uruguay (90.0%, a difference of 0.040%), and Ghanaian (90.0%, a difference of 0.050%).
| Demographics | Rating | Rank | 12th Grade, No Diploma |
| Blackfeet | 2.4 /100 | #232 | Tragic 90.1% |
| Immigrants | Thailand | 2.3 /100 | #233 | Tragic 90.1% |
| Immigrants | South America | 2.3 /100 | #234 | Tragic 90.1% |
| Colville | 2.3 /100 | #235 | Tragic 90.1% |
| Immigrants | Uzbekistan | 2.2 /100 | #236 | Tragic 90.1% |
| Immigrants | Colombia | 2.1 /100 | #237 | Tragic 90.1% |
| Inupiat | 2.0 /100 | #238 | Tragic 90.1% |
| Sub-Saharan Africans | 1.9 /100 | #239 | Tragic 90.1% |
| Kiowa | 1.7 /100 | #240 | Tragic 90.0% |
| Immigrants | Middle Africa | 1.7 /100 | #241 | Tragic 90.0% |
| Immigrants | Costa Rica | 1.6 /100 | #242 | Tragic 90.0% |
| Crow | 1.5 /100 | #243 | Tragic 90.0% |
| Taiwanese | 1.5 /100 | #244 | Tragic 90.0% |
| Immigrants | Uruguay | 1.4 /100 | #245 | Tragic 90.0% |
| Ghanaians | 1.3 /100 | #246 | Tragic 90.0% |
| Immigrants | Nigeria | 1.3 /100 | #247 | Tragic 89.9% |
| Comanche | 1.1 /100 | #248 | Tragic 89.9% |
| Senegalese | 1.1 /100 | #249 | Tragic 89.9% |
| Immigrants | Eritrea | 1.0 /100 | #250 | Tragic 89.9% |
| Spanish Americans | 0.9 /100 | #251 | Tragic 89.9% |
| Bahamians | 0.9 /100 | #252 | Tragic 89.9% |