Immigrants from Malaysia vs Immigrants from West Indies 3rd Grade
COMPARE
Immigrants from Malaysia
Immigrants from West Indies
3rd Grade
3rd Grade Comparison
Immigrants from Malaysia
Immigrants from West Indies
97.5%
3RD GRADE
2.4/ 100
METRIC RATING
233rd/ 347
METRIC RANK
97.1%
3RD GRADE
0.0/ 100
METRIC RATING
288th/ 347
METRIC RANK
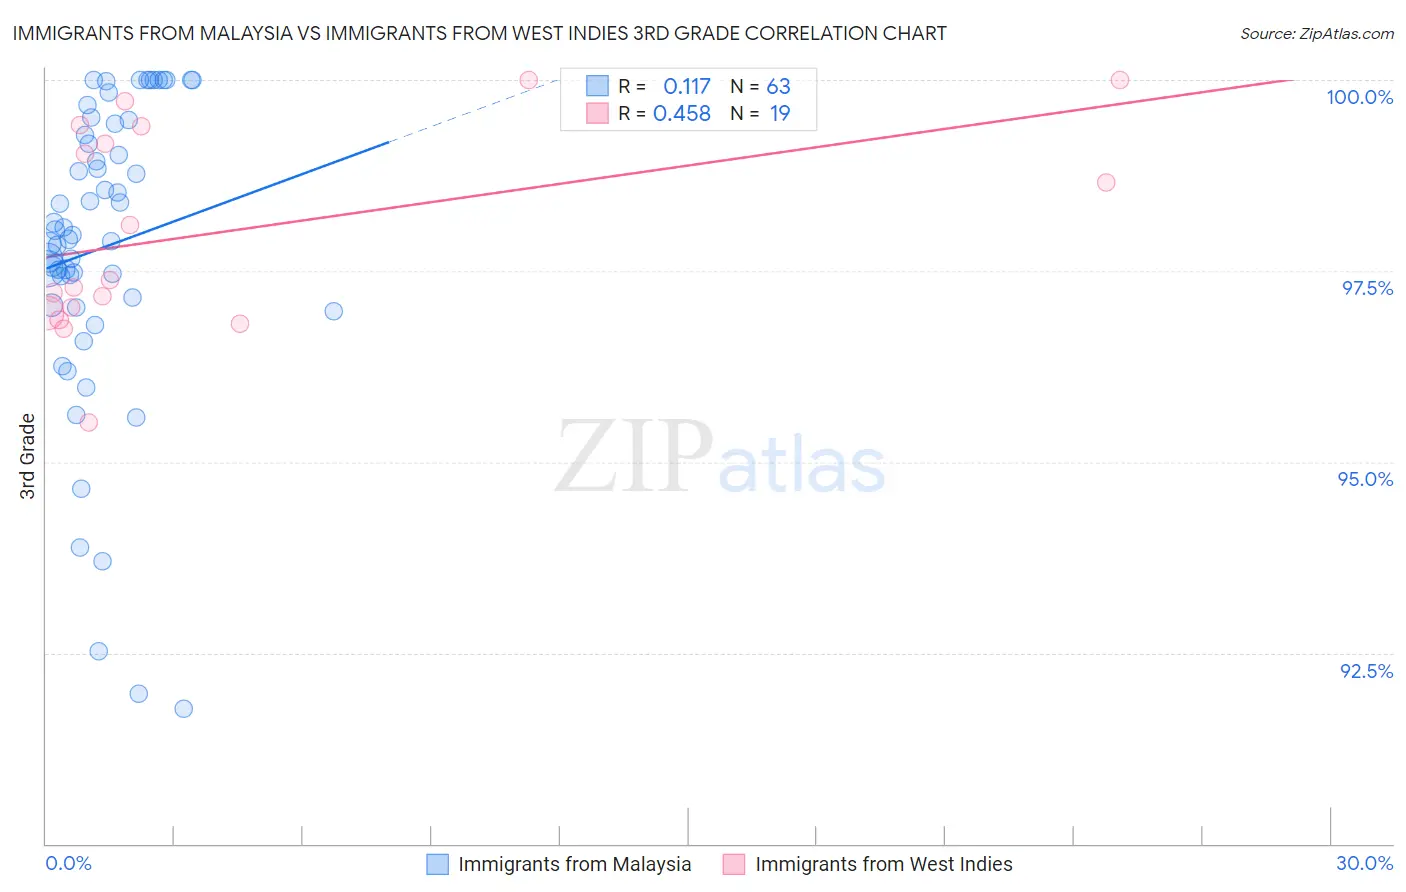
Immigrants from Malaysia vs Immigrants from West Indies 3rd Grade Correlation Chart
The statistical analysis conducted on geographies consisting of 197,973,709 people shows a poor positive correlation between the proportion of Immigrants from Malaysia and percentage of population with at least 3rd grade education in the United States with a correlation coefficient (R) of 0.117 and weighted average of 97.5%. Similarly, the statistical analysis conducted on geographies consisting of 72,457,514 people shows a moderate positive correlation between the proportion of Immigrants from West Indies and percentage of population with at least 3rd grade education in the United States with a correlation coefficient (R) of 0.458 and weighted average of 97.1%, a difference of 0.39%.
3rd Grade Correlation Summary
| Measurement | Immigrants from Malaysia | Immigrants from West Indies |
| Minimum | 91.8% | 95.5% |
| Maximum | 100.0% | 100.0% |
| Range | 8.2% | 4.5% |
| Mean | 97.8% | 98.0% |
| Median | 98.0% | 97.4% |
| Interquartile 25% (IQ1) | 97.0% | 96.9% |
| Interquartile 75% (IQ3) | 99.4% | 99.4% |
| Interquartile Range (IQR) | 2.4% | 2.4% |
| Standard Deviation (Sample) | 2.0% | 1.3% |
| Standard Deviation (Population) | 2.0% | 1.3% |
Similar Demographics by 3rd Grade
Demographics Similar to Immigrants from Malaysia by 3rd Grade
In terms of 3rd grade, the demographic groups most similar to Immigrants from Malaysia are Immigrants from Western Asia (97.5%, a difference of 0.0%), Immigrants from Pakistan (97.5%, a difference of 0.010%), Immigrants from Costa Rica (97.5%, a difference of 0.010%), Subsaharan African (97.5%, a difference of 0.020%), and Senegalese (97.5%, a difference of 0.020%).
| Demographics | Rating | Rank | 3rd Grade |
| Sudanese | 4.1 /100 | #226 | Tragic 97.5% |
| Immigrants | Sudan | 3.4 /100 | #227 | Tragic 97.5% |
| Sub-Saharan Africans | 3.2 /100 | #228 | Tragic 97.5% |
| Senegalese | 3.0 /100 | #229 | Tragic 97.5% |
| Immigrants | Pakistan | 2.7 /100 | #230 | Tragic 97.5% |
| Immigrants | Costa Rica | 2.7 /100 | #231 | Tragic 97.5% |
| Immigrants | Western Asia | 2.6 /100 | #232 | Tragic 97.5% |
| Immigrants | Malaysia | 2.4 /100 | #233 | Tragic 97.5% |
| Immigrants | Eastern Asia | 1.9 /100 | #234 | Tragic 97.4% |
| Immigrants | Iraq | 1.8 /100 | #235 | Tragic 97.4% |
| Liberians | 1.8 /100 | #236 | Tragic 97.4% |
| Colombians | 1.8 /100 | #237 | Tragic 97.4% |
| Immigrants | Uruguay | 1.7 /100 | #238 | Tragic 97.4% |
| Nigerians | 1.6 /100 | #239 | Tragic 97.4% |
| U.S. Virgin Islanders | 1.4 /100 | #240 | Tragic 97.4% |
Demographics Similar to Immigrants from West Indies by 3rd Grade
In terms of 3rd grade, the demographic groups most similar to Immigrants from West Indies are Immigrants from Barbados (97.1%, a difference of 0.010%), Immigrants from St. Vincent and the Grenadines (97.1%, a difference of 0.010%), Immigrants from Thailand (97.1%, a difference of 0.010%), Immigrants from Hong Kong (97.1%, a difference of 0.030%), and Immigrants from Portugal (97.0%, a difference of 0.040%).
| Demographics | Rating | Rank | 3rd Grade |
| Barbadians | 0.1 /100 | #281 | Tragic 97.2% |
| Afghans | 0.1 /100 | #282 | Tragic 97.1% |
| Houma | 0.1 /100 | #283 | Tragic 97.1% |
| Immigrants | Trinidad and Tobago | 0.0 /100 | #284 | Tragic 97.1% |
| Immigrants | Hong Kong | 0.0 /100 | #285 | Tragic 97.1% |
| Immigrants | Barbados | 0.0 /100 | #286 | Tragic 97.1% |
| Immigrants | St. Vincent and the Grenadines | 0.0 /100 | #287 | Tragic 97.1% |
| Immigrants | West Indies | 0.0 /100 | #288 | Tragic 97.1% |
| Immigrants | Thailand | 0.0 /100 | #289 | Tragic 97.1% |
| Immigrants | Portugal | 0.0 /100 | #290 | Tragic 97.0% |
| Immigrants | Afghanistan | 0.0 /100 | #291 | Tragic 97.0% |
| British West Indians | 0.0 /100 | #292 | Tragic 97.0% |
| Immigrants | Grenada | 0.0 /100 | #293 | Tragic 97.0% |
| Malaysians | 0.0 /100 | #294 | Tragic 97.0% |
| Immigrants | Eritrea | 0.0 /100 | #295 | Tragic 97.0% |