Immigrants from Lithuania vs Ukrainian No Schooling Completed
COMPARE
Immigrants from Lithuania
Ukrainian
No Schooling Completed
No Schooling Completed Comparison
Immigrants from Lithuania
Ukrainians
1.7%
NO SCHOOLING COMPLETED
99.7/ 100
METRIC RATING
68th/ 347
METRIC RANK
1.8%
NO SCHOOLING COMPLETED
99.2/ 100
METRIC RATING
86th/ 347
METRIC RANK
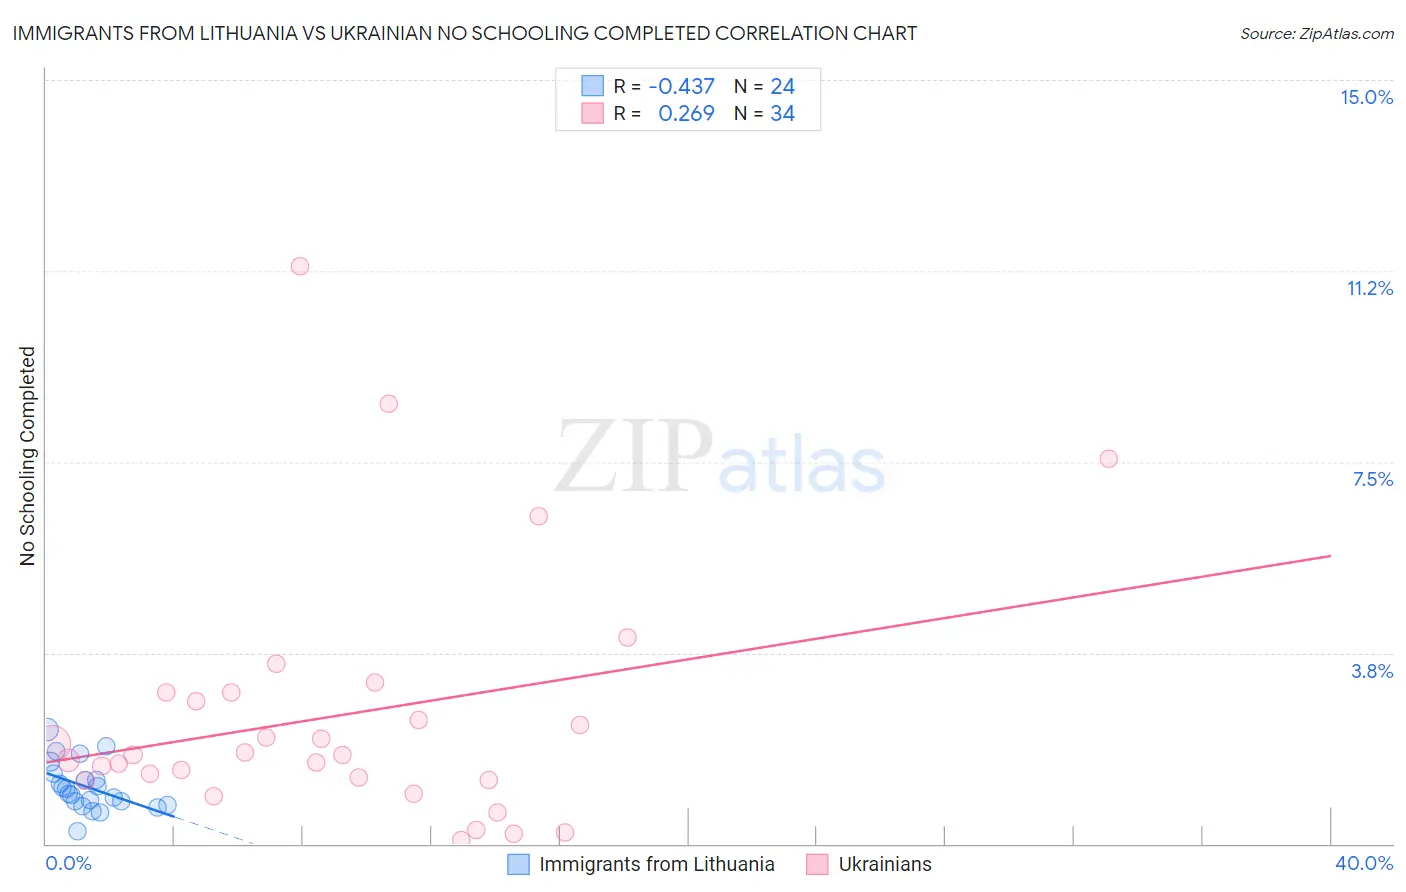
Immigrants from Lithuania vs Ukrainian No Schooling Completed Correlation Chart
The statistical analysis conducted on geographies consisting of 117,352,056 people shows a moderate negative correlation between the proportion of Immigrants from Lithuania and percentage of population with no schooling in the United States with a correlation coefficient (R) of -0.437 and weighted average of 1.7%. Similarly, the statistical analysis conducted on geographies consisting of 440,626,156 people shows a weak positive correlation between the proportion of Ukrainians and percentage of population with no schooling in the United States with a correlation coefficient (R) of 0.269 and weighted average of 1.8%, a difference of 3.6%.
No Schooling Completed Correlation Summary
| Measurement | Immigrants from Lithuania | Ukrainian |
| Minimum | 0.25% | 0.084% |
| Maximum | 2.2% | 11.3% |
| Range | 2.0% | 11.3% |
| Mean | 1.1% | 2.5% |
| Median | 1.0% | 1.7% |
| Interquartile 25% (IQ1) | 0.80% | 1.3% |
| Interquartile 75% (IQ3) | 1.3% | 3.0% |
| Interquartile Range (IQR) | 0.52% | 1.7% |
| Standard Deviation (Sample) | 0.47% | 2.5% |
| Standard Deviation (Population) | 0.46% | 2.4% |
Demographics Similar to Immigrants from Lithuania and Ukrainians by No Schooling Completed
In terms of no schooling completed, the demographic groups most similar to Immigrants from Lithuania are Chickasaw (1.7%, a difference of 0.27%), Immigrants from Austria (1.7%, a difference of 0.75%), Immigrants from Netherlands (1.7%, a difference of 1.3%), Immigrants from England (1.7%, a difference of 1.6%), and Cajun (1.7%, a difference of 1.8%). Similarly, the demographic groups most similar to Ukrainians are Immigrants from Australia (1.7%, a difference of 0.050%), Immigrants from Denmark (1.7%, a difference of 0.090%), Potawatomi (1.7%, a difference of 0.14%), Immigrants from South Africa (1.7%, a difference of 0.24%), and Osage (1.8%, a difference of 0.32%).
| Demographics | Rating | Rank | No Schooling Completed |
| Immigrants | Austria | 99.7 /100 | #67 | Exceptional 1.7% |
| Immigrants | Lithuania | 99.7 /100 | #68 | Exceptional 1.7% |
| Chickasaw | 99.6 /100 | #69 | Exceptional 1.7% |
| Immigrants | Netherlands | 99.6 /100 | #70 | Exceptional 1.7% |
| Immigrants | England | 99.5 /100 | #71 | Exceptional 1.7% |
| Cajuns | 99.5 /100 | #72 | Exceptional 1.7% |
| Immigrants | India | 99.4 /100 | #73 | Exceptional 1.7% |
| Zimbabweans | 99.4 /100 | #74 | Exceptional 1.7% |
| Immigrants | Belgium | 99.3 /100 | #75 | Exceptional 1.7% |
| Cherokee | 99.3 /100 | #76 | Exceptional 1.7% |
| Immigrants | Sweden | 99.3 /100 | #77 | Exceptional 1.7% |
| Delaware | 99.3 /100 | #78 | Exceptional 1.7% |
| Macedonians | 99.3 /100 | #79 | Exceptional 1.7% |
| Cypriots | 99.3 /100 | #80 | Exceptional 1.7% |
| Icelanders | 99.3 /100 | #81 | Exceptional 1.7% |
| Immigrants | South Africa | 99.3 /100 | #82 | Exceptional 1.7% |
| Potawatomi | 99.3 /100 | #83 | Exceptional 1.7% |
| Immigrants | Denmark | 99.2 /100 | #84 | Exceptional 1.7% |
| Immigrants | Australia | 99.2 /100 | #85 | Exceptional 1.7% |
| Ukrainians | 99.2 /100 | #86 | Exceptional 1.8% |
| Osage | 99.2 /100 | #87 | Exceptional 1.8% |