Immigrants from Lithuania vs Immigrants from Eastern Africa 8th Grade
COMPARE
Immigrants from Lithuania
Immigrants from Eastern Africa
8th Grade
8th Grade Comparison
Immigrants from Lithuania
Immigrants from Eastern Africa
96.6%
8TH GRADE
99.6/ 100
METRIC RATING
70th/ 347
METRIC RANK
95.3%
8TH GRADE
5.6/ 100
METRIC RATING
228th/ 347
METRIC RANK
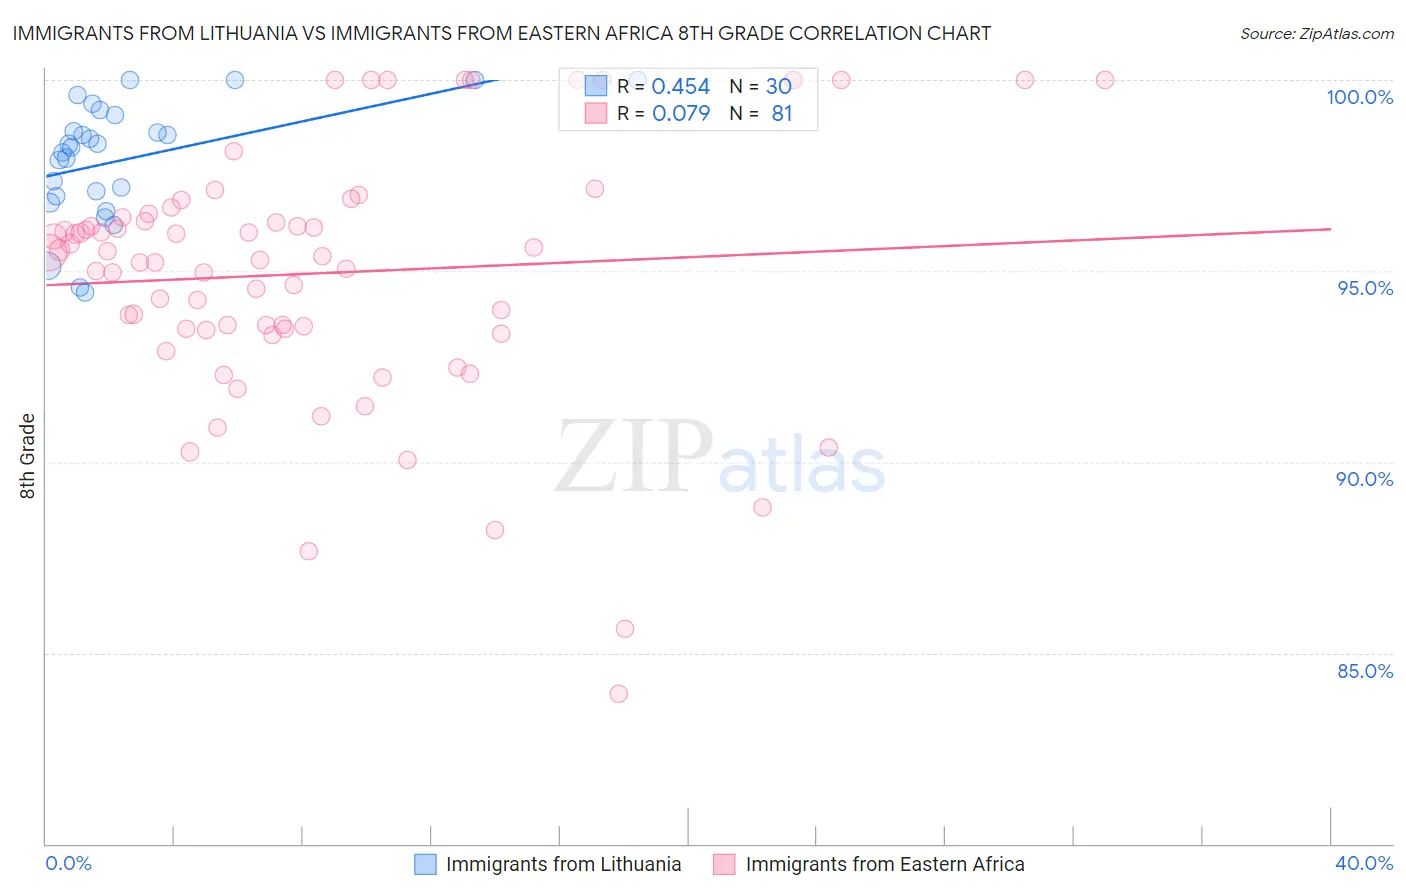
Immigrants from Lithuania vs Immigrants from Eastern Africa 8th Grade Correlation Chart
The statistical analysis conducted on geographies consisting of 117,724,932 people shows a moderate positive correlation between the proportion of Immigrants from Lithuania and percentage of population with at least 8th grade education in the United States with a correlation coefficient (R) of 0.454 and weighted average of 96.6%. Similarly, the statistical analysis conducted on geographies consisting of 355,144,184 people shows a slight positive correlation between the proportion of Immigrants from Eastern Africa and percentage of population with at least 8th grade education in the United States with a correlation coefficient (R) of 0.079 and weighted average of 95.3%, a difference of 1.4%.
8th Grade Correlation Summary
| Measurement | Immigrants from Lithuania | Immigrants from Eastern Africa |
| Minimum | 94.4% | 83.9% |
| Maximum | 100.0% | 100.0% |
| Range | 5.6% | 16.1% |
| Mean | 97.9% | 94.9% |
| Median | 98.3% | 95.4% |
| Interquartile 25% (IQ1) | 97.0% | 93.5% |
| Interquartile 75% (IQ3) | 99.1% | 96.5% |
| Interquartile Range (IQR) | 2.1% | 3.0% |
| Standard Deviation (Sample) | 1.6% | 3.3% |
| Standard Deviation (Population) | 1.5% | 3.3% |
Similar Demographics by 8th Grade
Demographics Similar to Immigrants from Lithuania by 8th Grade
In terms of 8th grade, the demographic groups most similar to Immigrants from Lithuania are American (96.6%, a difference of 0.020%), Creek (96.6%, a difference of 0.030%), Iranian (96.6%, a difference of 0.040%), Ukrainian (96.7%, a difference of 0.050%), and Immigrants from India (96.6%, a difference of 0.050%).
| Demographics | Rating | Rank | 8th Grade |
| Ukrainians | 99.7 /100 | #63 | Exceptional 96.7% |
| Immigrants | India | 99.7 /100 | #64 | Exceptional 96.6% |
| Native Hawaiians | 99.7 /100 | #65 | Exceptional 96.6% |
| Canadians | 99.7 /100 | #66 | Exceptional 96.6% |
| Iranians | 99.7 /100 | #67 | Exceptional 96.6% |
| Creek | 99.7 /100 | #68 | Exceptional 96.6% |
| Americans | 99.7 /100 | #69 | Exceptional 96.6% |
| Immigrants | Lithuania | 99.6 /100 | #70 | Exceptional 96.6% |
| New Zealanders | 99.5 /100 | #71 | Exceptional 96.6% |
| Immigrants | England | 99.5 /100 | #72 | Exceptional 96.6% |
| Arapaho | 99.5 /100 | #73 | Exceptional 96.6% |
| Immigrants | Ireland | 99.5 /100 | #74 | Exceptional 96.5% |
| Zimbabweans | 99.4 /100 | #75 | Exceptional 96.5% |
| Immigrants | Netherlands | 99.4 /100 | #76 | Exceptional 96.5% |
| Cypriots | 99.4 /100 | #77 | Exceptional 96.5% |
Demographics Similar to Immigrants from Eastern Africa by 8th Grade
In terms of 8th grade, the demographic groups most similar to Immigrants from Eastern Africa are Bahamian (95.3%, a difference of 0.0%), Immigrants from Western Asia (95.3%, a difference of 0.010%), Subsaharan African (95.3%, a difference of 0.010%), Navajo (95.3%, a difference of 0.010%), and Immigrants from Oceania (95.3%, a difference of 0.040%).
| Demographics | Rating | Rank | 8th Grade |
| Immigrants | Syria | 7.4 /100 | #221 | Tragic 95.3% |
| Immigrants | Malaysia | 7.3 /100 | #222 | Tragic 95.3% |
| Immigrants | Oceania | 7.1 /100 | #223 | Tragic 95.3% |
| Immigrants | Western Asia | 6.0 /100 | #224 | Tragic 95.3% |
| Sub-Saharan Africans | 6.0 /100 | #225 | Tragic 95.3% |
| Navajo | 5.7 /100 | #226 | Tragic 95.3% |
| Bahamians | 5.6 /100 | #227 | Tragic 95.3% |
| Immigrants | Eastern Africa | 5.6 /100 | #228 | Tragic 95.3% |
| Immigrants | Indonesia | 4.4 /100 | #229 | Tragic 95.3% |
| Immigrants | Panama | 4.1 /100 | #230 | Tragic 95.2% |
| Asians | 3.5 /100 | #231 | Tragic 95.2% |
| Indians (Asian) | 3.3 /100 | #232 | Tragic 95.2% |
| Immigrants | Asia | 3.1 /100 | #233 | Tragic 95.2% |
| Costa Ricans | 3.0 /100 | #234 | Tragic 95.2% |
| Nigerians | 2.9 /100 | #235 | Tragic 95.2% |