Immigrants from Lithuania vs German High School Diploma
COMPARE
Immigrants from Lithuania
German
High School Diploma
High School Diploma Comparison
Immigrants from Lithuania
Germans
91.3%
HIGH SCHOOL DIPLOMA
99.8/ 100
METRIC RATING
40th/ 347
METRIC RANK
91.7%
HIGH SCHOOL DIPLOMA
99.9/ 100
METRIC RATING
18th/ 347
METRIC RANK
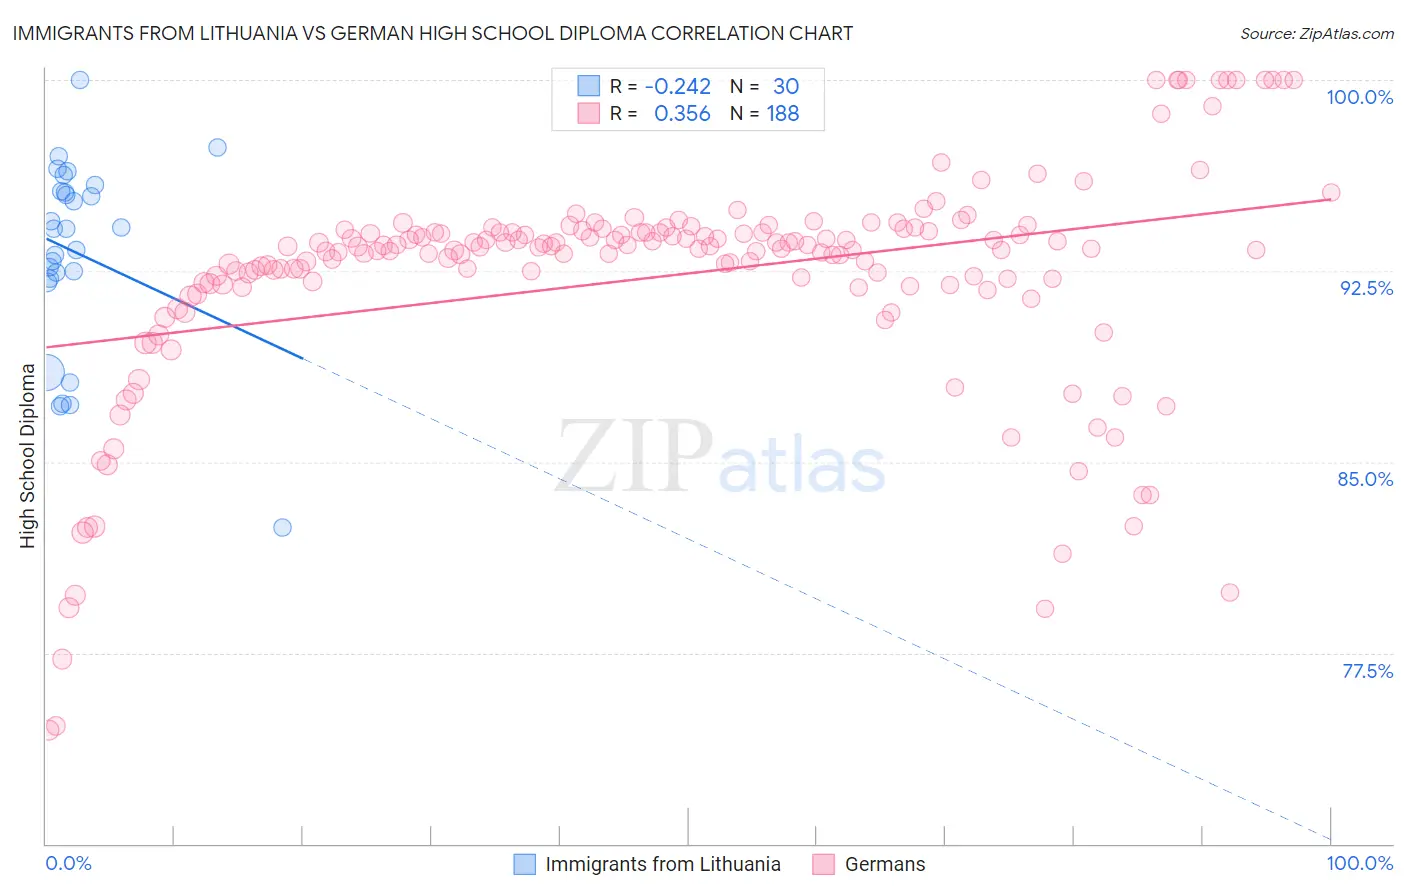
Immigrants from Lithuania vs German High School Diploma Correlation Chart
The statistical analysis conducted on geographies consisting of 117,724,932 people shows a weak negative correlation between the proportion of Immigrants from Lithuania and percentage of population with at least high school diploma education in the United States with a correlation coefficient (R) of -0.242 and weighted average of 91.3%. Similarly, the statistical analysis conducted on geographies consisting of 581,301,082 people shows a mild positive correlation between the proportion of Germans and percentage of population with at least high school diploma education in the United States with a correlation coefficient (R) of 0.356 and weighted average of 91.7%, a difference of 0.42%.
High School Diploma Correlation Summary
| Measurement | Immigrants from Lithuania | German |
| Minimum | 82.4% | 74.5% |
| Maximum | 100.0% | 100.0% |
| Range | 17.6% | 25.5% |
| Mean | 93.2% | 92.2% |
| Median | 94.1% | 93.4% |
| Interquartile 25% (IQ1) | 92.2% | 91.9% |
| Interquartile 75% (IQ3) | 95.6% | 94.0% |
| Interquartile Range (IQR) | 3.4% | 2.1% |
| Standard Deviation (Sample) | 3.8% | 4.5% |
| Standard Deviation (Population) | 3.7% | 4.5% |
Similar Demographics by High School Diploma
Demographics Similar to Immigrants from Lithuania by High School Diploma
In terms of high school diploma, the demographic groups most similar to Immigrants from Lithuania are Dutch (91.3%, a difference of 0.0%), Immigrants from Scotland (91.3%, a difference of 0.020%), Immigrants from Australia (91.3%, a difference of 0.020%), Northern European (91.3%, a difference of 0.030%), and Immigrants from Ireland (91.3%, a difference of 0.040%).
| Demographics | Rating | Rank | High School Diploma |
| Okinawans | 99.9 /100 | #33 | Exceptional 91.4% |
| Scottish | 99.9 /100 | #34 | Exceptional 91.4% |
| Irish | 99.9 /100 | #35 | Exceptional 91.4% |
| Tsimshian | 99.9 /100 | #36 | Exceptional 91.3% |
| Immigrants | Ireland | 99.9 /100 | #37 | Exceptional 91.3% |
| Immigrants | Scotland | 99.8 /100 | #38 | Exceptional 91.3% |
| Dutch | 99.8 /100 | #39 | Exceptional 91.3% |
| Immigrants | Lithuania | 99.8 /100 | #40 | Exceptional 91.3% |
| Immigrants | Australia | 99.8 /100 | #41 | Exceptional 91.3% |
| Northern Europeans | 99.8 /100 | #42 | Exceptional 91.3% |
| British | 99.8 /100 | #43 | Exceptional 91.3% |
| Immigrants | Austria | 99.8 /100 | #44 | Exceptional 91.3% |
| Turks | 99.8 /100 | #45 | Exceptional 91.2% |
| Greeks | 99.8 /100 | #46 | Exceptional 91.2% |
| Australians | 99.8 /100 | #47 | Exceptional 91.2% |
Demographics Similar to Germans by High School Diploma
In terms of high school diploma, the demographic groups most similar to Germans are Immigrants from Singapore (91.7%, a difference of 0.010%), Finnish (91.7%, a difference of 0.050%), Luxembourger (91.7%, a difference of 0.070%), Maltese (91.6%, a difference of 0.080%), and Bulgarian (91.8%, a difference of 0.10%).
| Demographics | Rating | Rank | High School Diploma |
| Eastern Europeans | 100.0 /100 | #11 | Exceptional 91.9% |
| Poles | 100.0 /100 | #12 | Exceptional 91.9% |
| Danes | 100.0 /100 | #13 | Exceptional 91.8% |
| Bulgarians | 100.0 /100 | #14 | Exceptional 91.8% |
| Luxembourgers | 100.0 /100 | #15 | Exceptional 91.7% |
| Finns | 100.0 /100 | #16 | Exceptional 91.7% |
| Immigrants | Singapore | 99.9 /100 | #17 | Exceptional 91.7% |
| Germans | 99.9 /100 | #18 | Exceptional 91.7% |
| Maltese | 99.9 /100 | #19 | Exceptional 91.6% |
| Czechs | 99.9 /100 | #20 | Exceptional 91.6% |
| Filipinos | 99.9 /100 | #21 | Exceptional 91.6% |
| Estonians | 99.9 /100 | #22 | Exceptional 91.6% |
| Scandinavians | 99.9 /100 | #23 | Exceptional 91.5% |
| Italians | 99.9 /100 | #24 | Exceptional 91.5% |
| Thais | 99.9 /100 | #25 | Exceptional 91.5% |