Immigrants from Lithuania vs Estonian Professional Degree
COMPARE
Immigrants from Lithuania
Estonian
Professional Degree
Professional Degree Comparison
Immigrants from Lithuania
Estonians
5.6%
PROFESSIONAL DEGREE
99.9/ 100
METRIC RATING
61st/ 347
METRIC RANK
6.0%
PROFESSIONAL DEGREE
100.0/ 100
METRIC RATING
42nd/ 347
METRIC RANK
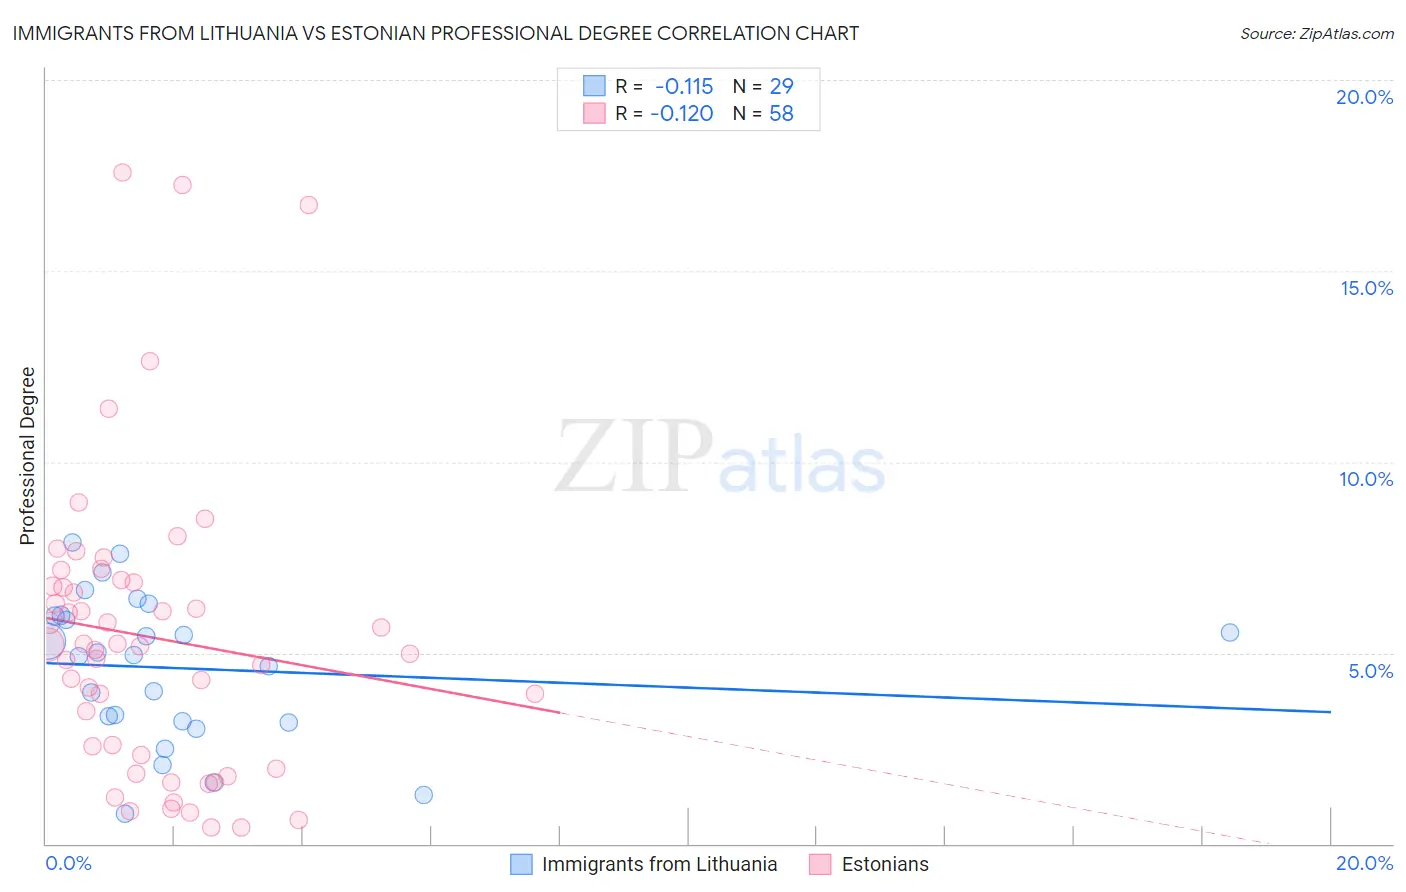
Immigrants from Lithuania vs Estonian Professional Degree Correlation Chart
The statistical analysis conducted on geographies consisting of 117,699,727 people shows a poor negative correlation between the proportion of Immigrants from Lithuania and percentage of population with at least professional degree education in the United States with a correlation coefficient (R) of -0.115 and weighted average of 5.6%. Similarly, the statistical analysis conducted on geographies consisting of 123,468,720 people shows a poor negative correlation between the proportion of Estonians and percentage of population with at least professional degree education in the United States with a correlation coefficient (R) of -0.120 and weighted average of 6.0%, a difference of 6.8%.
Professional Degree Correlation Summary
| Measurement | Immigrants from Lithuania | Estonian |
| Minimum | 0.77% | 0.42% |
| Maximum | 7.9% | 17.6% |
| Range | 7.1% | 17.2% |
| Mean | 4.6% | 5.4% |
| Median | 4.9% | 5.2% |
| Interquartile 25% (IQ1) | 3.2% | 2.3% |
| Interquartile 75% (IQ3) | 6.0% | 6.8% |
| Interquartile Range (IQR) | 2.8% | 4.5% |
| Standard Deviation (Sample) | 1.9% | 3.9% |
| Standard Deviation (Population) | 1.9% | 3.8% |
Demographics Similar to Immigrants from Lithuania and Estonians by Professional Degree
In terms of professional degree, the demographic groups most similar to Immigrants from Lithuania are Bolivian (5.6%, a difference of 0.65%), Immigrants from Europe (5.6%, a difference of 1.1%), Bulgarian (5.7%, a difference of 1.6%), South African (5.7%, a difference of 2.2%), and Immigrants from Malaysia (5.7%, a difference of 2.5%). Similarly, the demographic groups most similar to Estonians are New Zealander (6.0%, a difference of 0.010%), Immigrants from Saudi Arabia (5.9%, a difference of 0.32%), Argentinean (5.9%, a difference of 0.48%), Immigrants from South Central Asia (5.9%, a difference of 0.93%), and Immigrants from Argentina (5.9%, a difference of 1.1%).
| Demographics | Rating | Rank | Professional Degree |
| New Zealanders | 100.0 /100 | #41 | Exceptional 6.0% |
| Estonians | 100.0 /100 | #42 | Exceptional 6.0% |
| Immigrants | Saudi Arabia | 100.0 /100 | #43 | Exceptional 5.9% |
| Argentineans | 100.0 /100 | #44 | Exceptional 5.9% |
| Immigrants | South Central Asia | 100.0 /100 | #45 | Exceptional 5.9% |
| Immigrants | Argentina | 100.0 /100 | #46 | Exceptional 5.9% |
| Australians | 100.0 /100 | #47 | Exceptional 5.9% |
| Paraguayans | 100.0 /100 | #48 | Exceptional 5.9% |
| Immigrants | Latvia | 100.0 /100 | #49 | Exceptional 5.8% |
| Immigrants | Czechoslovakia | 100.0 /100 | #50 | Exceptional 5.8% |
| Immigrants | Greece | 100.0 /100 | #51 | Exceptional 5.8% |
| Immigrants | Serbia | 100.0 /100 | #52 | Exceptional 5.8% |
| Immigrants | Netherlands | 100.0 /100 | #53 | Exceptional 5.8% |
| Immigrants | Kuwait | 100.0 /100 | #54 | Exceptional 5.7% |
| Immigrants | Western Europe | 100.0 /100 | #55 | Exceptional 5.7% |
| Immigrants | Malaysia | 100.0 /100 | #56 | Exceptional 5.7% |
| South Africans | 100.0 /100 | #57 | Exceptional 5.7% |
| Bulgarians | 100.0 /100 | #58 | Exceptional 5.7% |
| Immigrants | Europe | 100.0 /100 | #59 | Exceptional 5.6% |
| Bolivians | 99.9 /100 | #60 | Exceptional 5.6% |
| Immigrants | Lithuania | 99.9 /100 | #61 | Exceptional 5.6% |