Immigrants from Liberia vs Fijian 10th Grade
COMPARE
Immigrants from Liberia
Fijian
10th Grade
10th Grade Comparison
Immigrants from Liberia
Fijians
93.3%
10TH GRADE
10.2/ 100
METRIC RATING
218th/ 347
METRIC RANK
91.5%
10TH GRADE
0.0/ 100
METRIC RATING
297th/ 347
METRIC RANK
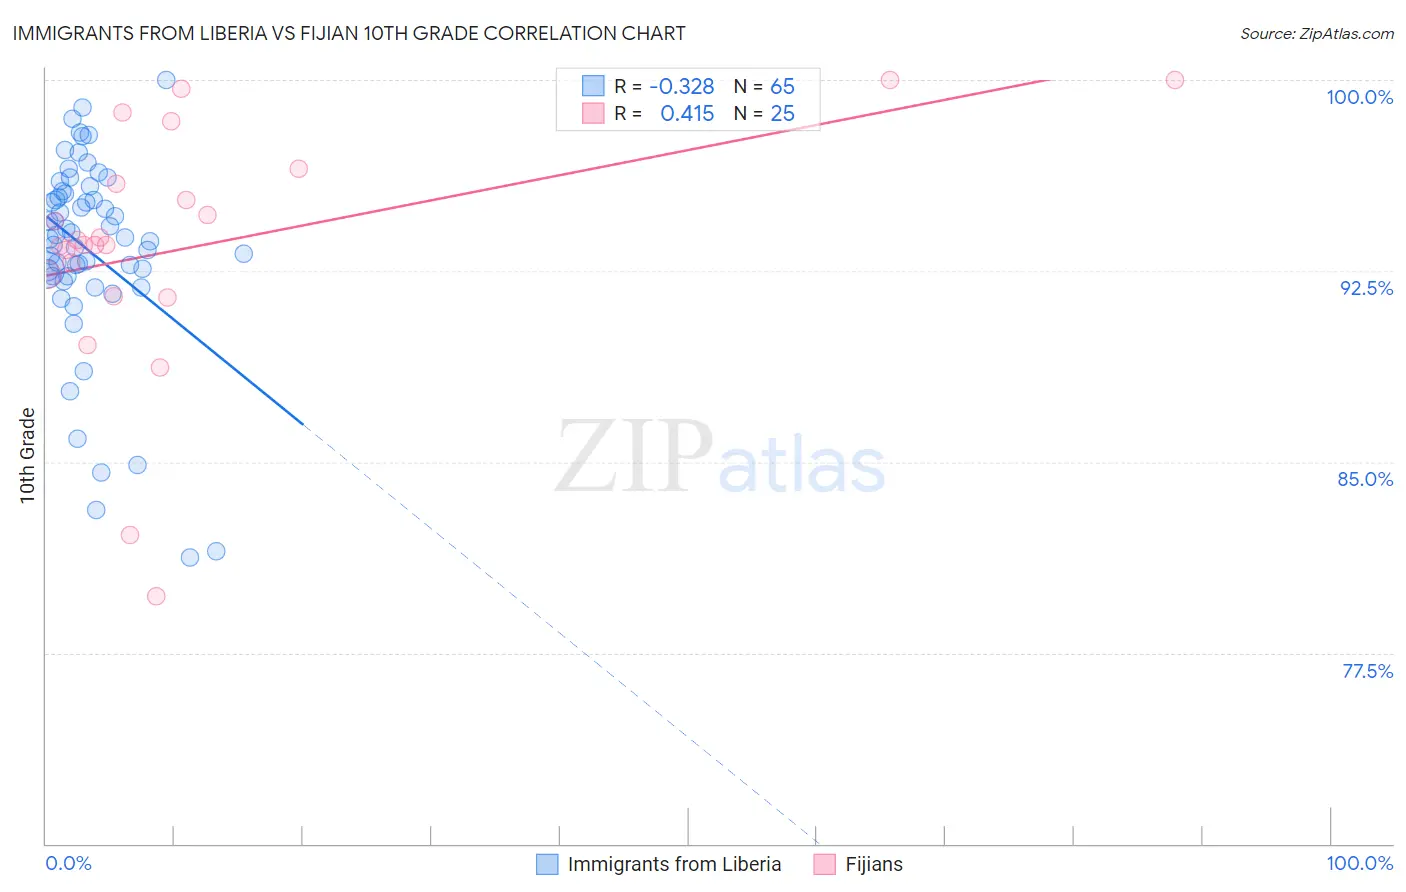
Immigrants from Liberia vs Fijian 10th Grade Correlation Chart
The statistical analysis conducted on geographies consisting of 135,295,697 people shows a mild negative correlation between the proportion of Immigrants from Liberia and percentage of population with at least 10th grade education in the United States with a correlation coefficient (R) of -0.328 and weighted average of 93.3%. Similarly, the statistical analysis conducted on geographies consisting of 55,948,842 people shows a moderate positive correlation between the proportion of Fijians and percentage of population with at least 10th grade education in the United States with a correlation coefficient (R) of 0.415 and weighted average of 91.5%, a difference of 1.9%.
10th Grade Correlation Summary
| Measurement | Immigrants from Liberia | Fijian |
| Minimum | 81.2% | 79.7% |
| Maximum | 100.0% | 100.0% |
| Range | 18.8% | 20.3% |
| Mean | 93.3% | 93.5% |
| Median | 93.8% | 93.5% |
| Interquartile 25% (IQ1) | 92.3% | 91.9% |
| Interquartile 75% (IQ3) | 95.6% | 96.2% |
| Interquartile Range (IQR) | 3.3% | 4.3% |
| Standard Deviation (Sample) | 3.9% | 4.8% |
| Standard Deviation (Population) | 3.9% | 4.7% |
Similar Demographics by 10th Grade
Demographics Similar to Immigrants from Liberia by 10th Grade
In terms of 10th grade, the demographic groups most similar to Immigrants from Liberia are Seminole (93.3%, a difference of 0.0%), Tongan (93.3%, a difference of 0.020%), Portuguese (93.3%, a difference of 0.040%), Immigrants from Southern Europe (93.2%, a difference of 0.040%), and Ethiopian (93.2%, a difference of 0.070%).
| Demographics | Rating | Rank | 10th Grade |
| Cajuns | 16.9 /100 | #211 | Poor 93.4% |
| Immigrants | Zaire | 16.7 /100 | #212 | Poor 93.4% |
| Immigrants | Asia | 15.7 /100 | #213 | Poor 93.4% |
| Immigrants | Bahamas | 15.2 /100 | #214 | Poor 93.4% |
| Immigrants | Oceania | 15.1 /100 | #215 | Poor 93.4% |
| Immigrants | Eastern Africa | 14.7 /100 | #216 | Poor 93.4% |
| Portuguese | 12.1 /100 | #217 | Poor 93.3% |
| Immigrants | Liberia | 10.2 /100 | #218 | Poor 93.3% |
| Seminole | 10.2 /100 | #219 | Poor 93.3% |
| Tongans | 9.5 /100 | #220 | Tragic 93.3% |
| Immigrants | Southern Europe | 8.9 /100 | #221 | Tragic 93.2% |
| Ethiopians | 7.9 /100 | #222 | Tragic 93.2% |
| Immigrants | Sierra Leone | 7.6 /100 | #223 | Tragic 93.2% |
| Bolivians | 6.7 /100 | #224 | Tragic 93.2% |
| Somalis | 6.2 /100 | #225 | Tragic 93.2% |
Demographics Similar to Fijians by 10th Grade
In terms of 10th grade, the demographic groups most similar to Fijians are Cuban (91.5%, a difference of 0.020%), Immigrants from Haiti (91.4%, a difference of 0.10%), Immigrants from Grenada (91.6%, a difference of 0.14%), Guyanese (91.4%, a difference of 0.15%), and Lumbee (91.7%, a difference of 0.27%).
| Demographics | Rating | Rank | 10th Grade |
| British West Indians | 0.0 /100 | #290 | Tragic 91.8% |
| Immigrants | West Indies | 0.0 /100 | #291 | Tragic 91.8% |
| Immigrants | Burma/Myanmar | 0.0 /100 | #292 | Tragic 91.8% |
| Indonesians | 0.0 /100 | #293 | Tragic 91.8% |
| Haitians | 0.0 /100 | #294 | Tragic 91.8% |
| Lumbee | 0.0 /100 | #295 | Tragic 91.7% |
| Immigrants | Grenada | 0.0 /100 | #296 | Tragic 91.6% |
| Fijians | 0.0 /100 | #297 | Tragic 91.5% |
| Cubans | 0.0 /100 | #298 | Tragic 91.5% |
| Immigrants | Haiti | 0.0 /100 | #299 | Tragic 91.4% |
| Guyanese | 0.0 /100 | #300 | Tragic 91.4% |
| Japanese | 0.0 /100 | #301 | Tragic 91.2% |
| Immigrants | Guyana | 0.0 /100 | #302 | Tragic 91.2% |
| Immigrants | Vietnam | 0.0 /100 | #303 | Tragic 91.2% |
| Pima | 0.0 /100 | #304 | Tragic 91.2% |