Immigrants from Lebanon vs Okinawan 11th Grade
COMPARE
Immigrants from Lebanon
Okinawan
11th Grade
11th Grade Comparison
Immigrants from Lebanon
Okinawans
92.7%
11TH GRADE
70.7/ 100
METRIC RATING
160th/ 347
METRIC RANK
94.0%
11TH GRADE
99.8/ 100
METRIC RATING
60th/ 347
METRIC RANK
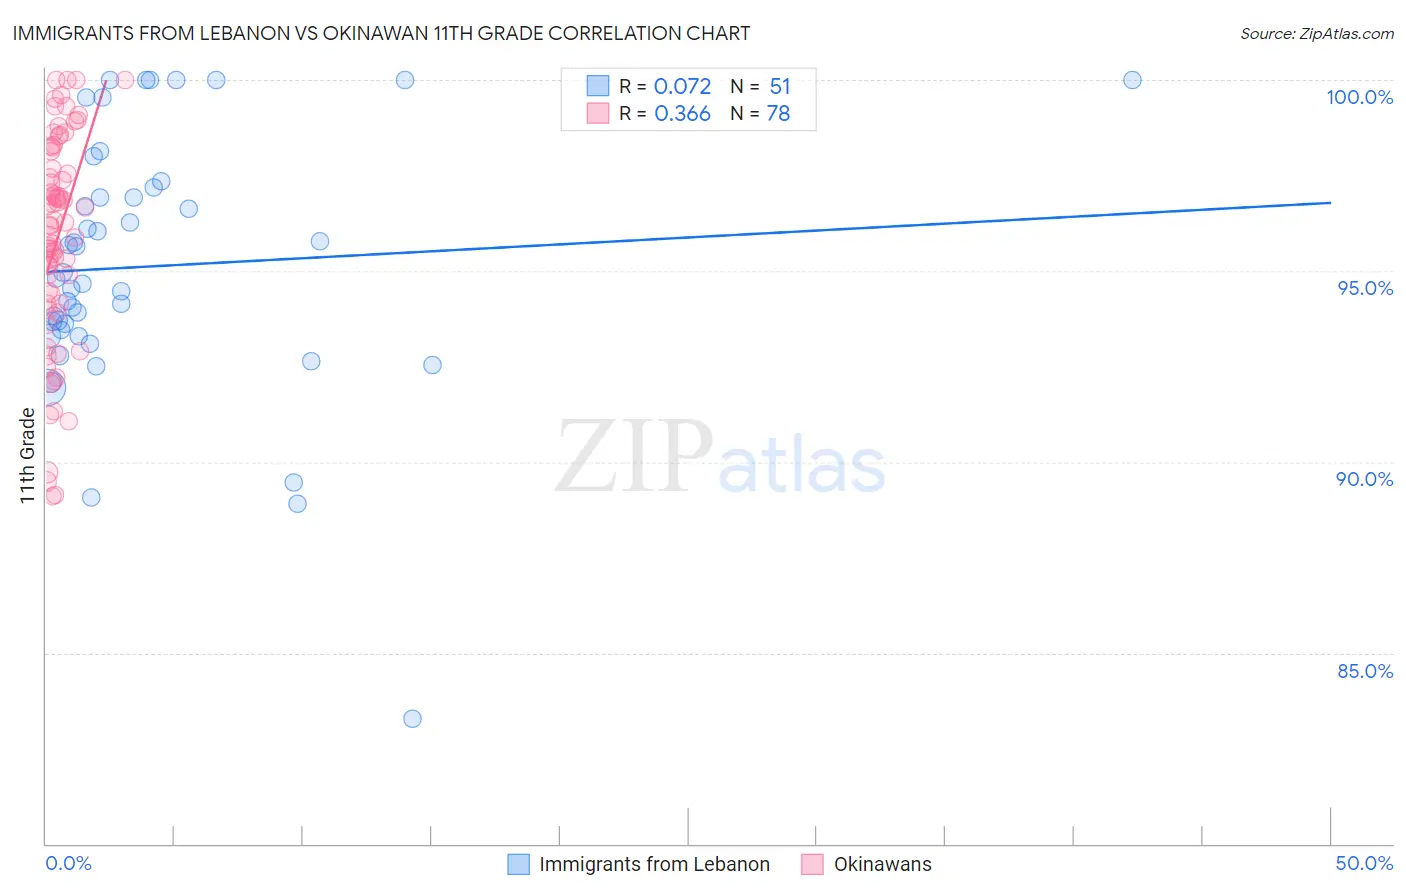
Immigrants from Lebanon vs Okinawan 11th Grade Correlation Chart
The statistical analysis conducted on geographies consisting of 217,083,357 people shows a slight positive correlation between the proportion of Immigrants from Lebanon and percentage of population with at least 11th grade education in the United States with a correlation coefficient (R) of 0.072 and weighted average of 92.7%. Similarly, the statistical analysis conducted on geographies consisting of 73,775,797 people shows a mild positive correlation between the proportion of Okinawans and percentage of population with at least 11th grade education in the United States with a correlation coefficient (R) of 0.366 and weighted average of 94.0%, a difference of 1.4%.
11th Grade Correlation Summary
| Measurement | Immigrants from Lebanon | Okinawan |
| Minimum | 83.3% | 89.1% |
| Maximum | 100.0% | 100.0% |
| Range | 16.7% | 10.9% |
| Mean | 95.1% | 95.9% |
| Median | 94.8% | 96.2% |
| Interquartile 25% (IQ1) | 93.3% | 94.1% |
| Interquartile 75% (IQ3) | 97.2% | 98.1% |
| Interquartile Range (IQR) | 3.9% | 4.0% |
| Standard Deviation (Sample) | 3.4% | 2.8% |
| Standard Deviation (Population) | 3.3% | 2.7% |
Similar Demographics by 11th Grade
Demographics Similar to Immigrants from Lebanon by 11th Grade
In terms of 11th grade, the demographic groups most similar to Immigrants from Lebanon are American (92.7%, a difference of 0.010%), Immigrants from Argentina (92.7%, a difference of 0.010%), Immigrants from Eastern Asia (92.7%, a difference of 0.020%), Immigrants from Venezuela (92.7%, a difference of 0.020%), and Paraguayan (92.7%, a difference of 0.020%).
| Demographics | Rating | Rank | 11th Grade |
| Brazilians | 73.9 /100 | #153 | Good 92.8% |
| Osage | 73.4 /100 | #154 | Good 92.7% |
| Argentineans | 73.4 /100 | #155 | Good 92.7% |
| Immigrants | Spain | 73.0 /100 | #156 | Good 92.7% |
| Immigrants | Eastern Asia | 72.6 /100 | #157 | Good 92.7% |
| Immigrants | Venezuela | 72.0 /100 | #158 | Good 92.7% |
| Americans | 71.7 /100 | #159 | Good 92.7% |
| Immigrants | Lebanon | 70.7 /100 | #160 | Good 92.7% |
| Immigrants | Argentina | 69.8 /100 | #161 | Good 92.7% |
| Paraguayans | 68.7 /100 | #162 | Good 92.7% |
| Immigrants | Nonimmigrants | 66.6 /100 | #163 | Good 92.7% |
| Spanish | 66.2 /100 | #164 | Good 92.7% |
| Immigrants | Iraq | 63.7 /100 | #165 | Good 92.6% |
| Bermudans | 62.3 /100 | #166 | Good 92.6% |
| Alsatians | 60.2 /100 | #167 | Good 92.6% |
Demographics Similar to Okinawans by 11th Grade
In terms of 11th grade, the demographic groups most similar to Okinawans are French Canadian (94.0%, a difference of 0.0%), New Zealander (94.0%, a difference of 0.0%), Iranian (94.0%, a difference of 0.0%), Bhutanese (94.0%, a difference of 0.0%), and Immigrants from North America (94.0%, a difference of 0.010%).
| Demographics | Rating | Rank | 11th Grade |
| Immigrants | Australia | 99.9 /100 | #53 | Exceptional 94.0% |
| Immigrants | North America | 99.9 /100 | #54 | Exceptional 94.0% |
| Czechoslovakians | 99.9 /100 | #55 | Exceptional 94.0% |
| French Canadians | 99.9 /100 | #56 | Exceptional 94.0% |
| New Zealanders | 99.9 /100 | #57 | Exceptional 94.0% |
| Iranians | 99.9 /100 | #58 | Exceptional 94.0% |
| Bhutanese | 99.8 /100 | #59 | Exceptional 94.0% |
| Okinawans | 99.8 /100 | #60 | Exceptional 94.0% |
| Immigrants | Belgium | 99.8 /100 | #61 | Exceptional 94.0% |
| Austrians | 99.8 /100 | #62 | Exceptional 94.0% |
| Ukrainians | 99.8 /100 | #63 | Exceptional 94.0% |
| Immigrants | Sweden | 99.8 /100 | #64 | Exceptional 93.9% |
| Native Hawaiians | 99.8 /100 | #65 | Exceptional 93.9% |
| Alaskan Athabascans | 99.8 /100 | #66 | Exceptional 93.9% |
| Immigrants | Netherlands | 99.8 /100 | #67 | Exceptional 93.9% |