Immigrants from Lebanon vs Immigrants from Colombia 5th Grade
COMPARE
Immigrants from Lebanon
Immigrants from Colombia
5th Grade
5th Grade Comparison
Immigrants from Lebanon
Immigrants from Colombia
97.1%
5TH GRADE
6.8/ 100
METRIC RATING
217th/ 347
METRIC RANK
96.8%
5TH GRADE
0.4/ 100
METRIC RATING
262nd/ 347
METRIC RANK
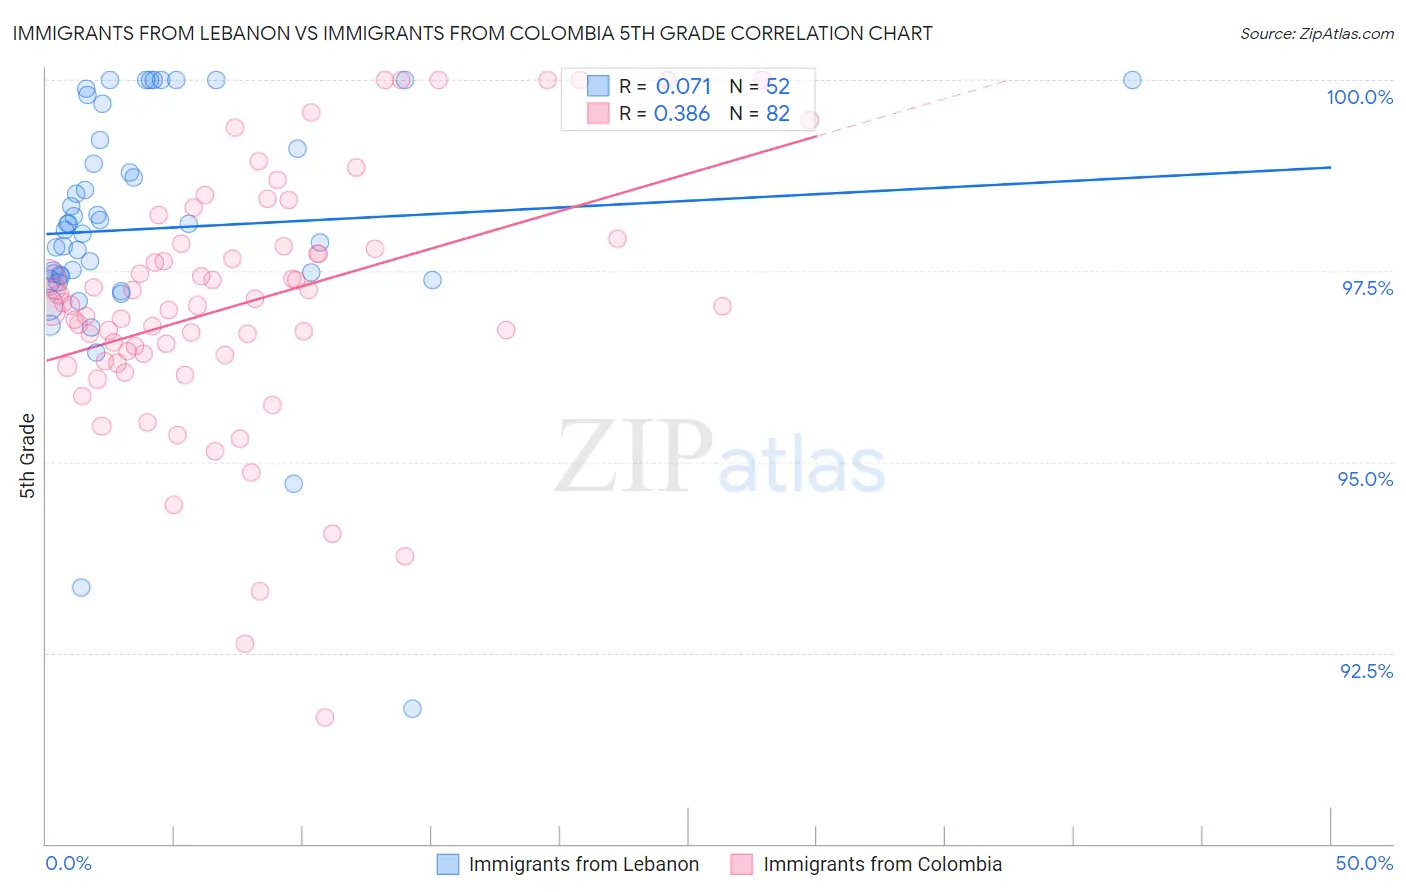
Immigrants from Lebanon vs Immigrants from Colombia 5th Grade Correlation Chart
The statistical analysis conducted on geographies consisting of 217,155,328 people shows a slight positive correlation between the proportion of Immigrants from Lebanon and percentage of population with at least 5th grade education in the United States with a correlation coefficient (R) of 0.071 and weighted average of 97.1%. Similarly, the statistical analysis conducted on geographies consisting of 378,643,693 people shows a mild positive correlation between the proportion of Immigrants from Colombia and percentage of population with at least 5th grade education in the United States with a correlation coefficient (R) of 0.386 and weighted average of 96.8%, a difference of 0.31%.
5th Grade Correlation Summary
| Measurement | Immigrants from Lebanon | Immigrants from Colombia |
| Minimum | 91.8% | 91.6% |
| Maximum | 100.0% | 100.0% |
| Range | 8.2% | 8.4% |
| Mean | 98.1% | 97.1% |
| Median | 98.1% | 97.0% |
| Interquartile 25% (IQ1) | 97.4% | 96.4% |
| Interquartile 75% (IQ3) | 99.2% | 97.8% |
| Interquartile Range (IQR) | 1.8% | 1.4% |
| Standard Deviation (Sample) | 1.6% | 1.7% |
| Standard Deviation (Population) | 1.6% | 1.6% |
Similar Demographics by 5th Grade
Demographics Similar to Immigrants from Lebanon by 5th Grade
In terms of 5th grade, the demographic groups most similar to Immigrants from Lebanon are Sudanese (97.1%, a difference of 0.0%), Immigrants from Sudan (97.1%, a difference of 0.0%), Portuguese (97.1%, a difference of 0.010%), Costa Rican (97.1%, a difference of 0.010%), and Immigrants from Morocco (97.1%, a difference of 0.010%).
| Demographics | Rating | Rank | 5th Grade |
| Immigrants | Oceania | 10.0 /100 | #210 | Poor 97.1% |
| Samoans | 8.5 /100 | #211 | Tragic 97.1% |
| Immigrants | Iraq | 8.3 /100 | #212 | Tragic 97.1% |
| Portuguese | 7.8 /100 | #213 | Tragic 97.1% |
| Costa Ricans | 7.7 /100 | #214 | Tragic 97.1% |
| Immigrants | Morocco | 7.5 /100 | #215 | Tragic 97.1% |
| Sudanese | 7.0 /100 | #216 | Tragic 97.1% |
| Immigrants | Lebanon | 6.8 /100 | #217 | Tragic 97.1% |
| Immigrants | Sudan | 6.5 /100 | #218 | Tragic 97.1% |
| Immigrants | Syria | 6.4 /100 | #219 | Tragic 97.1% |
| Immigrants | Southern Europe | 6.3 /100 | #220 | Tragic 97.1% |
| Sierra Leoneans | 6.0 /100 | #221 | Tragic 97.1% |
| Immigrants | Panama | 5.7 /100 | #222 | Tragic 97.0% |
| Liberians | 5.7 /100 | #223 | Tragic 97.0% |
| South American Indians | 5.4 /100 | #224 | Tragic 97.0% |
Demographics Similar to Immigrants from Colombia by 5th Grade
In terms of 5th grade, the demographic groups most similar to Immigrants from Colombia are Immigrants from Jamaica (96.8%, a difference of 0.0%), Immigrants from Sierra Leone (96.8%, a difference of 0.0%), Immigrants from Uzbekistan (96.8%, a difference of 0.010%), West Indian (96.8%, a difference of 0.010%), and Immigrants from China (96.8%, a difference of 0.020%).
| Demographics | Rating | Rank | 5th Grade |
| South Americans | 0.7 /100 | #255 | Tragic 96.8% |
| Immigrants | Congo | 0.7 /100 | #256 | Tragic 96.8% |
| Peruvians | 0.6 /100 | #257 | Tragic 96.8% |
| Immigrants | Ethiopia | 0.5 /100 | #258 | Tragic 96.8% |
| Immigrants | China | 0.5 /100 | #259 | Tragic 96.8% |
| Immigrants | Jamaica | 0.4 /100 | #260 | Tragic 96.8% |
| Immigrants | Sierra Leone | 0.4 /100 | #261 | Tragic 96.8% |
| Immigrants | Colombia | 0.4 /100 | #262 | Tragic 96.8% |
| Immigrants | Uzbekistan | 0.3 /100 | #263 | Tragic 96.8% |
| West Indians | 0.3 /100 | #264 | Tragic 96.8% |
| Taiwanese | 0.3 /100 | #265 | Tragic 96.7% |
| Immigrants | Nigeria | 0.3 /100 | #266 | Tragic 96.7% |
| Immigrants | South America | 0.3 /100 | #267 | Tragic 96.7% |
| Armenians | 0.3 /100 | #268 | Tragic 96.7% |
| Ghanaians | 0.2 /100 | #269 | Tragic 96.7% |