Immigrants from Latvia vs Slovak 3rd Grade
COMPARE
Immigrants from Latvia
Slovak
3rd Grade
3rd Grade Comparison
Immigrants from Latvia
Slovaks
98.0%
3RD GRADE
96.0/ 100
METRIC RATING
112th/ 347
METRIC RANK
98.6%
3RD GRADE
100.0/ 100
METRIC RATING
8th/ 347
METRIC RANK
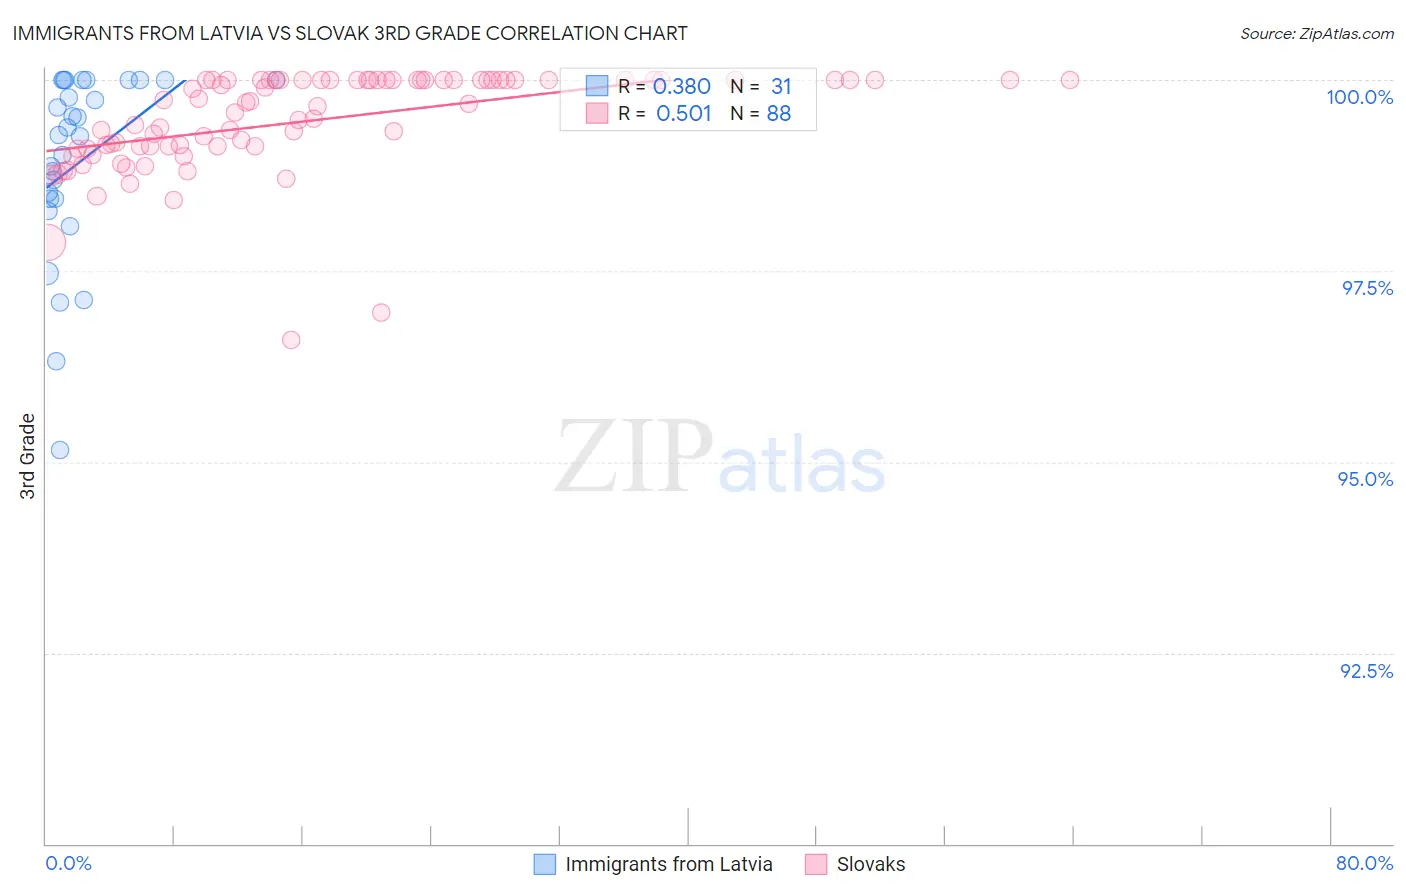
Immigrants from Latvia vs Slovak 3rd Grade Correlation Chart
The statistical analysis conducted on geographies consisting of 113,735,345 people shows a mild positive correlation between the proportion of Immigrants from Latvia and percentage of population with at least 3rd grade education in the United States with a correlation coefficient (R) of 0.380 and weighted average of 98.0%. Similarly, the statistical analysis conducted on geographies consisting of 397,890,986 people shows a substantial positive correlation between the proportion of Slovaks and percentage of population with at least 3rd grade education in the United States with a correlation coefficient (R) of 0.501 and weighted average of 98.6%, a difference of 0.59%.
3rd Grade Correlation Summary
| Measurement | Immigrants from Latvia | Slovak |
| Minimum | 95.2% | 96.6% |
| Maximum | 100.0% | 100.0% |
| Range | 4.8% | 3.4% |
| Mean | 98.9% | 99.5% |
| Median | 99.3% | 99.7% |
| Interquartile 25% (IQ1) | 98.4% | 99.1% |
| Interquartile 75% (IQ3) | 100.0% | 100.0% |
| Interquartile Range (IQR) | 1.6% | 0.87% |
| Standard Deviation (Sample) | 1.2% | 0.66% |
| Standard Deviation (Population) | 1.2% | 0.65% |
Similar Demographics by 3rd Grade
Demographics Similar to Immigrants from Latvia by 3rd Grade
In terms of 3rd grade, the demographic groups most similar to Immigrants from Latvia are Basque (98.0%, a difference of 0.010%), Thai (98.0%, a difference of 0.010%), Menominee (98.0%, a difference of 0.010%), Immigrants from Czechoslovakia (98.0%, a difference of 0.020%), and Immigrants from Singapore (98.0%, a difference of 0.020%).
| Demographics | Rating | Rank | 3rd Grade |
| German Russians | 97.2 /100 | #105 | Exceptional 98.1% |
| Bhutanese | 97.2 /100 | #106 | Exceptional 98.1% |
| Immigrants | Czechoslovakia | 97.0 /100 | #107 | Exceptional 98.0% |
| Immigrants | Singapore | 96.7 /100 | #108 | Exceptional 98.0% |
| Pima | 96.7 /100 | #109 | Exceptional 98.0% |
| Immigrants | Switzerland | 96.6 /100 | #110 | Exceptional 98.0% |
| Basques | 96.5 /100 | #111 | Exceptional 98.0% |
| Immigrants | Latvia | 96.0 /100 | #112 | Exceptional 98.0% |
| Thais | 95.5 /100 | #113 | Exceptional 98.0% |
| Menominee | 95.4 /100 | #114 | Exceptional 98.0% |
| Okinawans | 95.2 /100 | #115 | Exceptional 98.0% |
| Immigrants | Norway | 95.2 /100 | #116 | Exceptional 98.0% |
| Immigrants | France | 95.1 /100 | #117 | Exceptional 98.0% |
| Iranians | 94.9 /100 | #118 | Exceptional 98.0% |
| Spanish | 94.8 /100 | #119 | Exceptional 98.0% |
Demographics Similar to Slovaks by 3rd Grade
In terms of 3rd grade, the demographic groups most similar to Slovaks are German (98.6%, a difference of 0.0%), Norwegian (98.6%, a difference of 0.020%), Alaska Native (98.6%, a difference of 0.030%), Slovene (98.6%, a difference of 0.030%), and English (98.6%, a difference of 0.050%).
| Demographics | Rating | Rank | 3rd Grade |
| Crow | 100.0 /100 | #1 | Exceptional 99.6% |
| Yup'ik | 100.0 /100 | #2 | Exceptional 99.0% |
| Welsh | 100.0 /100 | #3 | Exceptional 98.8% |
| Inupiat | 100.0 /100 | #4 | Exceptional 98.8% |
| Tsimshian | 100.0 /100 | #5 | Exceptional 98.8% |
| Alaskan Athabascans | 100.0 /100 | #6 | Exceptional 98.7% |
| Norwegians | 100.0 /100 | #7 | Exceptional 98.6% |
| Slovaks | 100.0 /100 | #8 | Exceptional 98.6% |
| Germans | 100.0 /100 | #9 | Exceptional 98.6% |
| Alaska Natives | 100.0 /100 | #10 | Exceptional 98.6% |
| Slovenes | 100.0 /100 | #11 | Exceptional 98.6% |
| English | 100.0 /100 | #12 | Exceptional 98.6% |
| Tlingit-Haida | 100.0 /100 | #13 | Exceptional 98.5% |
| Carpatho Rusyns | 100.0 /100 | #14 | Exceptional 98.5% |
| Swedes | 100.0 /100 | #15 | Exceptional 98.5% |