Immigrants from Latvia vs Canadian 12th Grade, No Diploma
COMPARE
Immigrants from Latvia
Canadian
12th Grade, No Diploma
12th Grade, No Diploma Comparison
Immigrants from Latvia
Canadians
92.6%
12TH GRADE, NO DIPLOMA
99.5/ 100
METRIC RATING
71st/ 347
METRIC RANK
92.4%
12TH GRADE, NO DIPLOMA
98.7/ 100
METRIC RATING
89th/ 347
METRIC RANK
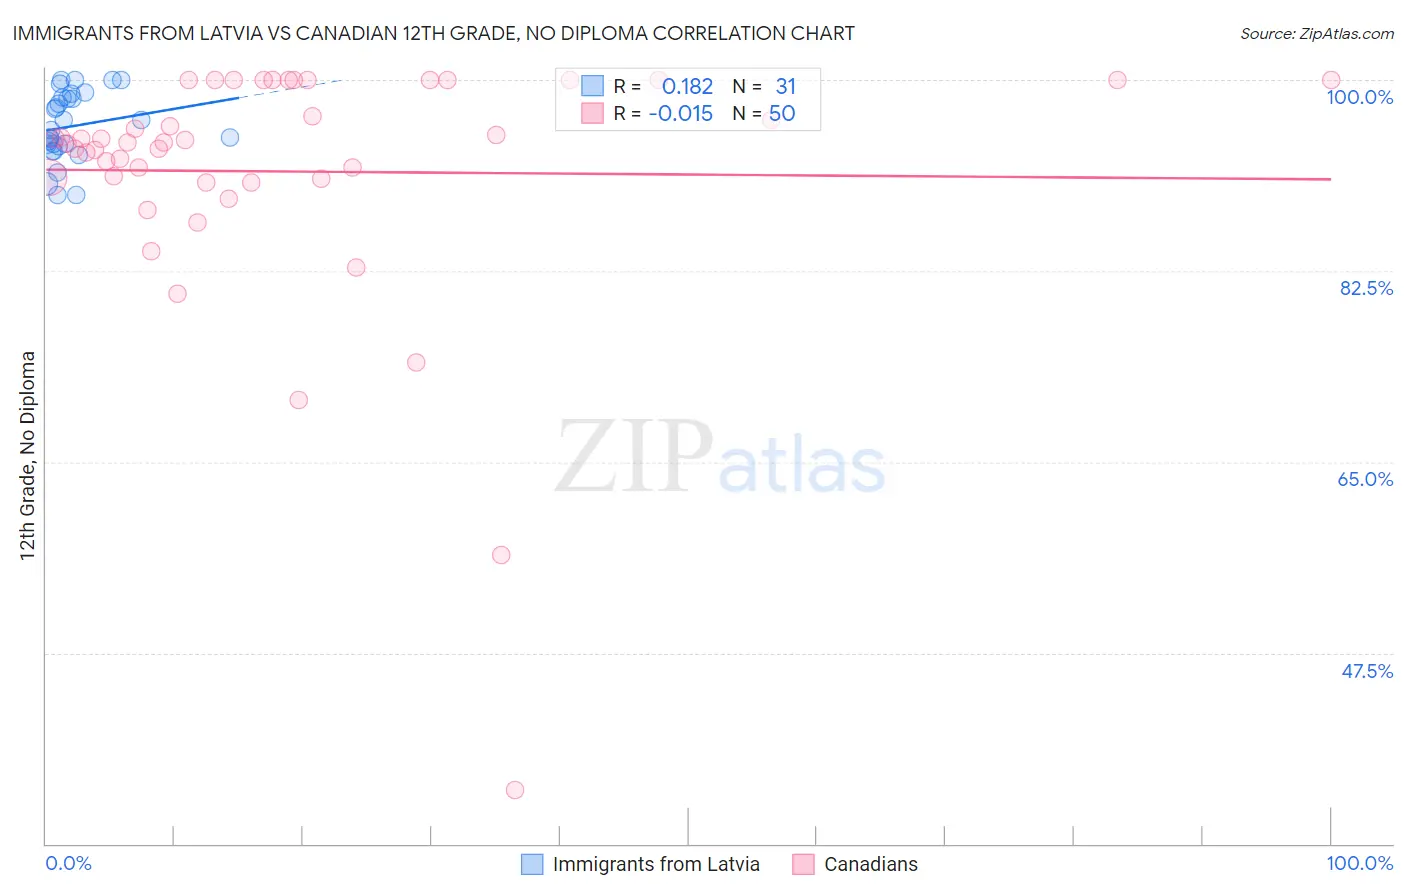
Immigrants from Latvia vs Canadian 12th Grade, No Diploma Correlation Chart
The statistical analysis conducted on geographies consisting of 113,735,345 people shows a poor positive correlation between the proportion of Immigrants from Latvia and percentage of population with at least 12th grade (no diploma) education in the United States with a correlation coefficient (R) of 0.182 and weighted average of 92.6%. Similarly, the statistical analysis conducted on geographies consisting of 437,556,598 people shows no correlation between the proportion of Canadians and percentage of population with at least 12th grade (no diploma) education in the United States with a correlation coefficient (R) of -0.015 and weighted average of 92.4%, a difference of 0.29%.
12th Grade, No Diploma Correlation Summary
| Measurement | Immigrants from Latvia | Canadian |
| Minimum | 89.5% | 34.9% |
| Maximum | 100.0% | 100.0% |
| Range | 10.5% | 65.1% |
| Mean | 95.8% | 91.6% |
| Median | 95.4% | 94.2% |
| Interquartile 25% (IQ1) | 94.0% | 90.9% |
| Interquartile 75% (IQ3) | 98.4% | 100.0% |
| Interquartile Range (IQR) | 4.4% | 9.1% |
| Standard Deviation (Sample) | 3.1% | 11.7% |
| Standard Deviation (Population) | 3.1% | 11.5% |
Demographics Similar to Immigrants from Latvia and Canadians by 12th Grade, No Diploma
In terms of 12th grade, no diploma, the demographic groups most similar to Immigrants from Latvia are Czechoslovakian (92.6%, a difference of 0.010%), Immigrants from South Central Asia (92.6%, a difference of 0.010%), Burmese (92.6%, a difference of 0.030%), Immigrants from Moldova (92.6%, a difference of 0.030%), and Native Hawaiian (92.6%, a difference of 0.030%). Similarly, the demographic groups most similar to Canadians are Immigrants from Serbia (92.4%, a difference of 0.010%), Immigrants from France (92.4%, a difference of 0.030%), Scotch-Irish (92.4%, a difference of 0.030%), Immigrants from Turkey (92.4%, a difference of 0.050%), and Immigrants from Saudi Arabia (92.5%, a difference of 0.10%).
| Demographics | Rating | Rank | 12th Grade, No Diploma |
| Czechoslovakians | 99.5 /100 | #70 | Exceptional 92.6% |
| Immigrants | Latvia | 99.5 /100 | #71 | Exceptional 92.6% |
| Immigrants | South Central Asia | 99.5 /100 | #72 | Exceptional 92.6% |
| Burmese | 99.4 /100 | #73 | Exceptional 92.6% |
| Immigrants | Moldova | 99.4 /100 | #74 | Exceptional 92.6% |
| Native Hawaiians | 99.4 /100 | #75 | Exceptional 92.6% |
| French | 99.4 /100 | #76 | Exceptional 92.6% |
| Immigrants | England | 99.4 /100 | #77 | Exceptional 92.6% |
| Cambodians | 99.3 /100 | #78 | Exceptional 92.6% |
| Romanians | 99.3 /100 | #79 | Exceptional 92.6% |
| French Canadians | 99.3 /100 | #80 | Exceptional 92.6% |
| Immigrants | Denmark | 99.2 /100 | #81 | Exceptional 92.5% |
| Immigrants | Switzerland | 99.2 /100 | #82 | Exceptional 92.5% |
| Immigrants | Israel | 99.2 /100 | #83 | Exceptional 92.5% |
| Immigrants | Bulgaria | 99.1 /100 | #84 | Exceptional 92.5% |
| Immigrants | Saudi Arabia | 99.0 /100 | #85 | Exceptional 92.5% |
| Immigrants | Turkey | 98.9 /100 | #86 | Exceptional 92.4% |
| Immigrants | France | 98.8 /100 | #87 | Exceptional 92.4% |
| Scotch-Irish | 98.8 /100 | #88 | Exceptional 92.4% |
| Canadians | 98.7 /100 | #89 | Exceptional 92.4% |
| Immigrants | Serbia | 98.6 /100 | #90 | Exceptional 92.4% |