Immigrants from Laos vs Immigrants from Middle Africa Doctorate Degree
COMPARE
Immigrants from Laos
Immigrants from Middle Africa
Doctorate Degree
Doctorate Degree Comparison
Immigrants from Laos
Immigrants from Middle Africa
1.4%
DOCTORATE DEGREE
0.1/ 100
METRIC RATING
308th/ 347
METRIC RANK
1.9%
DOCTORATE DEGREE
68.8/ 100
METRIC RATING
161st/ 347
METRIC RANK
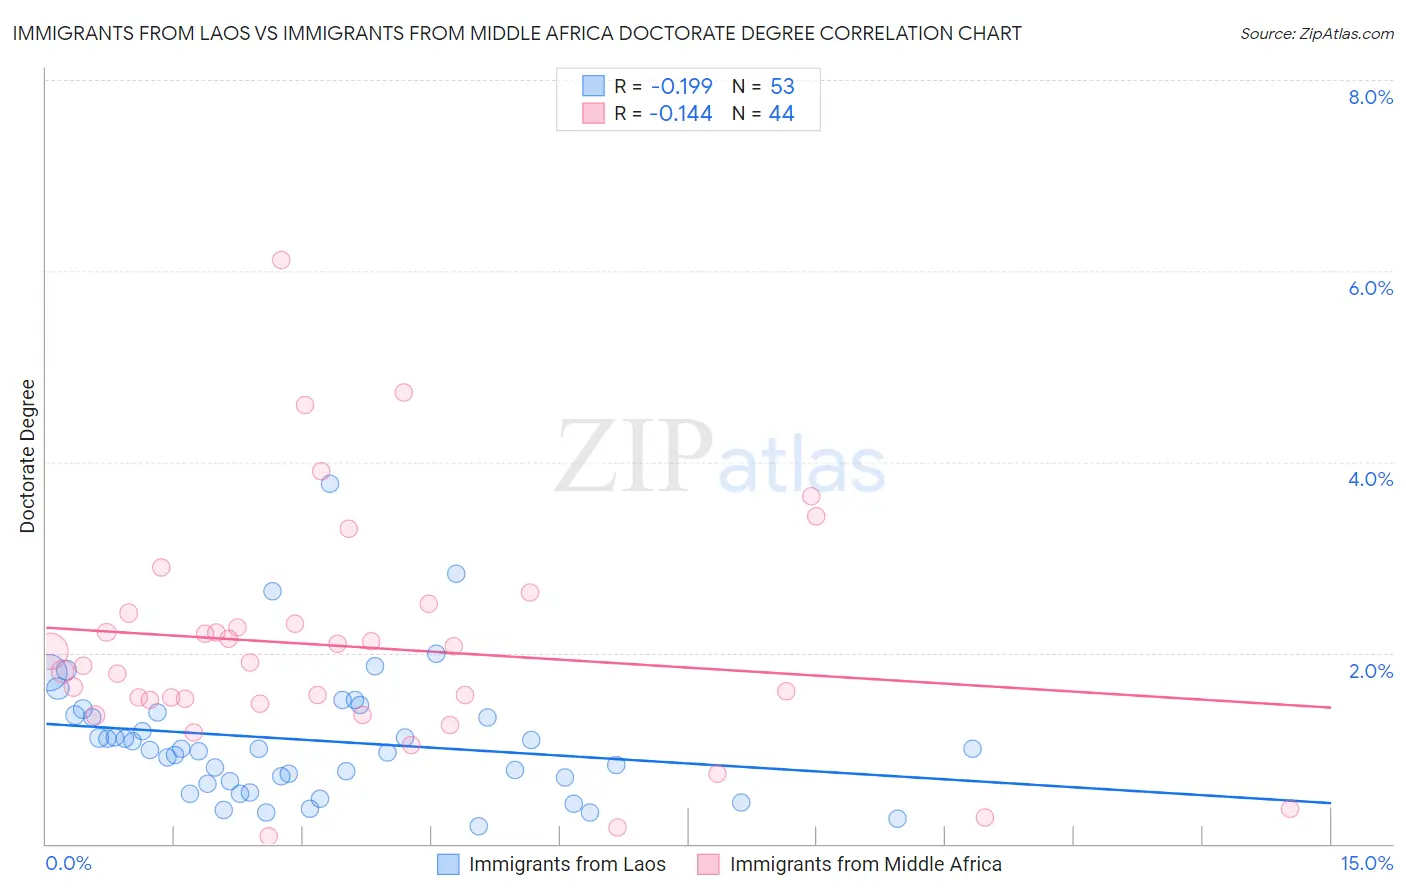
Immigrants from Laos vs Immigrants from Middle Africa Doctorate Degree Correlation Chart
The statistical analysis conducted on geographies consisting of 200,482,890 people shows a poor negative correlation between the proportion of Immigrants from Laos and percentage of population with at least doctorate degree education in the United States with a correlation coefficient (R) of -0.199 and weighted average of 1.4%. Similarly, the statistical analysis conducted on geographies consisting of 202,038,624 people shows a poor negative correlation between the proportion of Immigrants from Middle Africa and percentage of population with at least doctorate degree education in the United States with a correlation coefficient (R) of -0.144 and weighted average of 1.9%, a difference of 37.5%.
Doctorate Degree Correlation Summary
| Measurement | Immigrants from Laos | Immigrants from Middle Africa |
| Minimum | 0.18% | 0.076% |
| Maximum | 3.8% | 6.1% |
| Range | 3.6% | 6.0% |
| Mean | 1.1% | 2.1% |
| Median | 1.00% | 1.9% |
| Interquartile 25% (IQ1) | 0.64% | 1.5% |
| Interquartile 75% (IQ3) | 1.4% | 2.4% |
| Interquartile Range (IQR) | 0.72% | 0.87% |
| Standard Deviation (Sample) | 0.67% | 1.2% |
| Standard Deviation (Population) | 0.67% | 1.2% |
Similar Demographics by Doctorate Degree
Demographics Similar to Immigrants from Laos by Doctorate Degree
In terms of doctorate degree, the demographic groups most similar to Immigrants from Laos are Cuban (1.4%, a difference of 0.050%), Guyanese (1.4%, a difference of 0.30%), Pennsylvania German (1.4%, a difference of 0.31%), Immigrants from Grenada (1.4%, a difference of 0.41%), and Mexican American Indian (1.4%, a difference of 0.45%).
| Demographics | Rating | Rank | Doctorate Degree |
| Hondurans | 0.1 /100 | #301 | Tragic 1.4% |
| Shoshone | 0.1 /100 | #302 | Tragic 1.4% |
| Immigrants | Dominica | 0.1 /100 | #303 | Tragic 1.4% |
| Mexican American Indians | 0.1 /100 | #304 | Tragic 1.4% |
| Pennsylvania Germans | 0.1 /100 | #305 | Tragic 1.4% |
| Guyanese | 0.1 /100 | #306 | Tragic 1.4% |
| Cubans | 0.1 /100 | #307 | Tragic 1.4% |
| Immigrants | Laos | 0.1 /100 | #308 | Tragic 1.4% |
| Immigrants | Grenada | 0.1 /100 | #309 | Tragic 1.4% |
| Immigrants | Jamaica | 0.1 /100 | #310 | Tragic 1.4% |
| Immigrants | Honduras | 0.1 /100 | #311 | Tragic 1.4% |
| Immigrants | Nicaragua | 0.1 /100 | #312 | Tragic 1.4% |
| Menominee | 0.1 /100 | #313 | Tragic 1.4% |
| Dominicans | 0.1 /100 | #314 | Tragic 1.4% |
| Immigrants | Azores | 0.1 /100 | #315 | Tragic 1.4% |
Demographics Similar to Immigrants from Middle Africa by Doctorate Degree
In terms of doctorate degree, the demographic groups most similar to Immigrants from Middle Africa are Welsh (1.9%, a difference of 0.15%), Irish (1.9%, a difference of 0.21%), Slovene (1.9%, a difference of 0.24%), Czech (1.9%, a difference of 0.25%), and Celtic (1.9%, a difference of 0.35%).
| Demographics | Rating | Rank | Doctorate Degree |
| Immigrants | Albania | 72.8 /100 | #154 | Good 1.9% |
| Poles | 72.7 /100 | #155 | Good 1.9% |
| Slavs | 72.4 /100 | #156 | Good 1.9% |
| Danes | 71.9 /100 | #157 | Good 1.9% |
| Hungarians | 71.7 /100 | #158 | Good 1.9% |
| Slovenes | 70.2 /100 | #159 | Good 1.9% |
| Welsh | 69.7 /100 | #160 | Good 1.9% |
| Immigrants | Middle Africa | 68.8 /100 | #161 | Good 1.9% |
| Irish | 67.5 /100 | #162 | Good 1.9% |
| Czechs | 67.3 /100 | #163 | Good 1.9% |
| Celtics | 66.7 /100 | #164 | Good 1.9% |
| Scotch-Irish | 63.6 /100 | #165 | Good 1.9% |
| Spaniards | 63.5 /100 | #166 | Good 1.9% |
| Macedonians | 60.9 /100 | #167 | Good 1.9% |
| Sri Lankans | 60.3 /100 | #168 | Good 1.9% |