Immigrants from Korea vs Paraguayan 8th Grade
COMPARE
Immigrants from Korea
Paraguayan
8th Grade
8th Grade Comparison
Immigrants from Korea
Paraguayans
95.8%
8TH GRADE
57.9/ 100
METRIC RATING
172nd/ 347
METRIC RANK
95.5%
8TH GRADE
22.6/ 100
METRIC RATING
198th/ 347
METRIC RANK
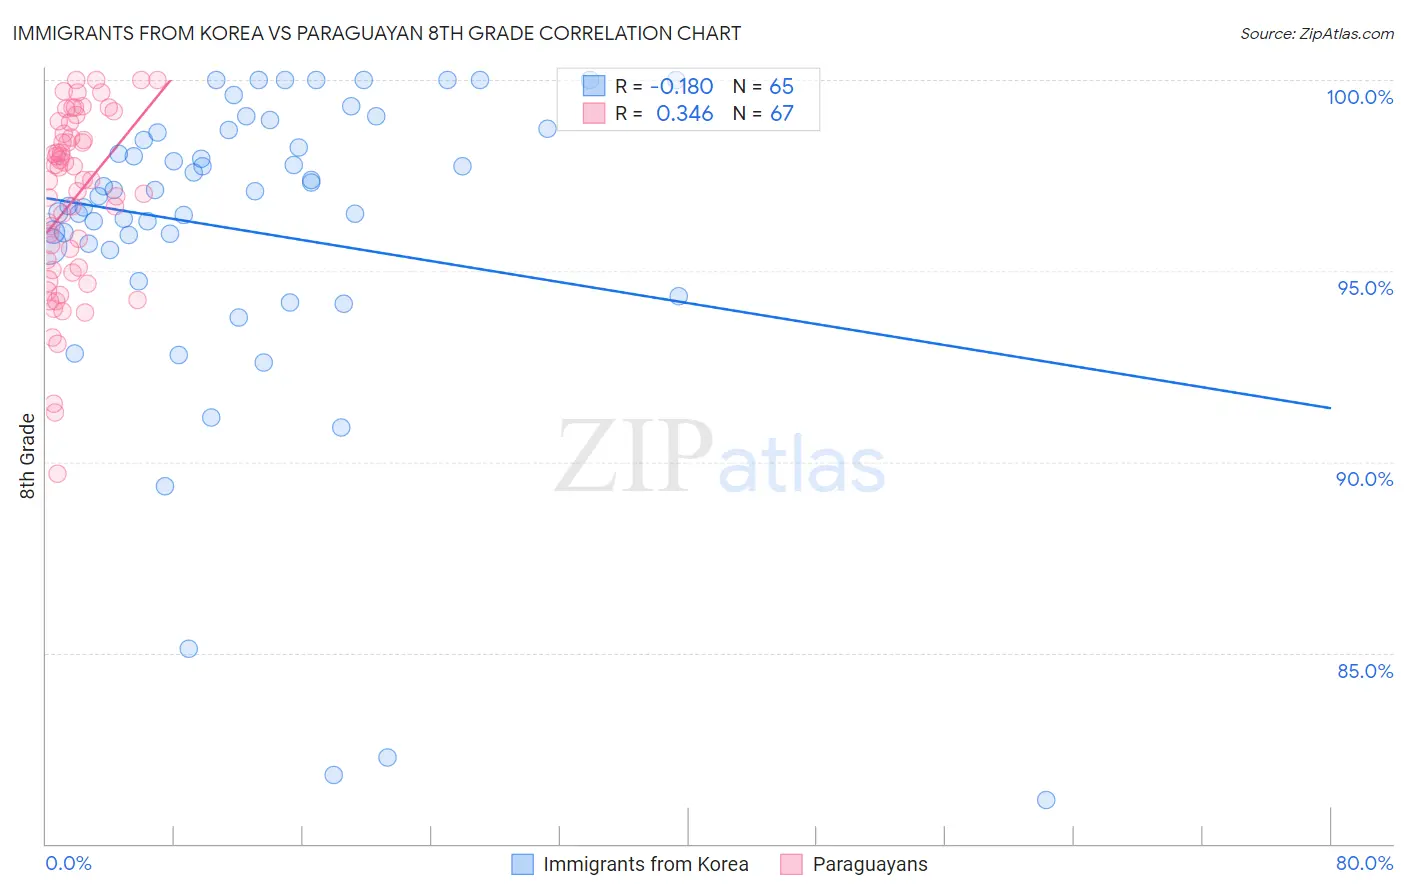
Immigrants from Korea vs Paraguayan 8th Grade Correlation Chart
The statistical analysis conducted on geographies consisting of 416,280,217 people shows a poor negative correlation between the proportion of Immigrants from Korea and percentage of population with at least 8th grade education in the United States with a correlation coefficient (R) of -0.180 and weighted average of 95.8%. Similarly, the statistical analysis conducted on geographies consisting of 95,113,577 people shows a mild positive correlation between the proportion of Paraguayans and percentage of population with at least 8th grade education in the United States with a correlation coefficient (R) of 0.346 and weighted average of 95.5%, a difference of 0.25%.
8th Grade Correlation Summary
| Measurement | Immigrants from Korea | Paraguayan |
| Minimum | 81.1% | 89.7% |
| Maximum | 100.0% | 100.0% |
| Range | 18.9% | 10.3% |
| Mean | 96.0% | 96.8% |
| Median | 97.1% | 97.4% |
| Interquartile 25% (IQ1) | 95.6% | 95.0% |
| Interquartile 75% (IQ3) | 98.7% | 98.6% |
| Interquartile Range (IQR) | 3.0% | 3.6% |
| Standard Deviation (Sample) | 4.2% | 2.3% |
| Standard Deviation (Population) | 4.2% | 2.3% |
Similar Demographics by 8th Grade
Demographics Similar to Immigrants from Korea by 8th Grade
In terms of 8th grade, the demographic groups most similar to Immigrants from Korea are Immigrants from Iran (95.8%, a difference of 0.0%), Ute (95.8%, a difference of 0.0%), Egyptian (95.8%, a difference of 0.0%), Spaniard (95.8%, a difference of 0.010%), and Immigrants from Ukraine (95.8%, a difference of 0.010%).
| Demographics | Rating | Rank | 8th Grade |
| Alsatians | 61.4 /100 | #165 | Good 95.8% |
| Immigrants | Poland | 61.1 /100 | #166 | Good 95.8% |
| Spaniards | 60.0 /100 | #167 | Good 95.8% |
| Immigrants | Ukraine | 59.5 /100 | #168 | Average 95.8% |
| Immigrants | Iran | 58.6 /100 | #169 | Average 95.8% |
| Ute | 58.5 /100 | #170 | Average 95.8% |
| Egyptians | 58.2 /100 | #171 | Average 95.8% |
| Immigrants | Korea | 57.9 /100 | #172 | Average 95.8% |
| Mongolians | 53.0 /100 | #173 | Average 95.8% |
| Chileans | 50.0 /100 | #174 | Average 95.7% |
| Immigrants | Albania | 49.6 /100 | #175 | Average 95.7% |
| Pakistanis | 48.8 /100 | #176 | Average 95.7% |
| Marshallese | 47.6 /100 | #177 | Average 95.7% |
| Venezuelans | 47.5 /100 | #178 | Average 95.7% |
| Immigrants | Brazil | 45.4 /100 | #179 | Average 95.7% |
Demographics Similar to Paraguayans by 8th Grade
In terms of 8th grade, the demographic groups most similar to Paraguayans are Immigrants from Northern Africa (95.5%, a difference of 0.0%), Argentinean (95.5%, a difference of 0.0%), Immigrants from Zaire (95.6%, a difference of 0.020%), Assyrian/Chaldean/Syriac (95.6%, a difference of 0.020%), and Sierra Leonean (95.6%, a difference of 0.020%).
| Demographics | Rating | Rank | 8th Grade |
| Immigrants | Nepal | 30.2 /100 | #191 | Fair 95.6% |
| Pima | 28.6 /100 | #192 | Fair 95.6% |
| Panamanians | 28.4 /100 | #193 | Fair 95.6% |
| Guamanians/Chamorros | 26.6 /100 | #194 | Fair 95.6% |
| Immigrants | Zaire | 25.2 /100 | #195 | Fair 95.6% |
| Assyrians/Chaldeans/Syriacs | 24.5 /100 | #196 | Fair 95.6% |
| Sierra Leoneans | 24.3 /100 | #197 | Fair 95.6% |
| Paraguayans | 22.6 /100 | #198 | Fair 95.5% |
| Immigrants | Northern Africa | 22.5 /100 | #199 | Fair 95.5% |
| Argentineans | 22.2 /100 | #200 | Fair 95.5% |
| Immigrants | Argentina | 20.6 /100 | #201 | Fair 95.5% |
| Apache | 19.4 /100 | #202 | Poor 95.5% |
| Moroccans | 17.4 /100 | #203 | Poor 95.5% |
| Hawaiians | 16.7 /100 | #204 | Poor 95.5% |
| Immigrants | Bahamas | 16.7 /100 | #205 | Poor 95.5% |