Immigrants from Korea vs Nepalese 2nd Grade
COMPARE
Immigrants from Korea
Nepalese
2nd Grade
2nd Grade Comparison
Immigrants from Korea
Nepalese
97.9%
2ND GRADE
52.7/ 100
METRIC RATING
172nd/ 347
METRIC RANK
96.1%
2ND GRADE
0.0/ 100
METRIC RATING
343rd/ 347
METRIC RANK
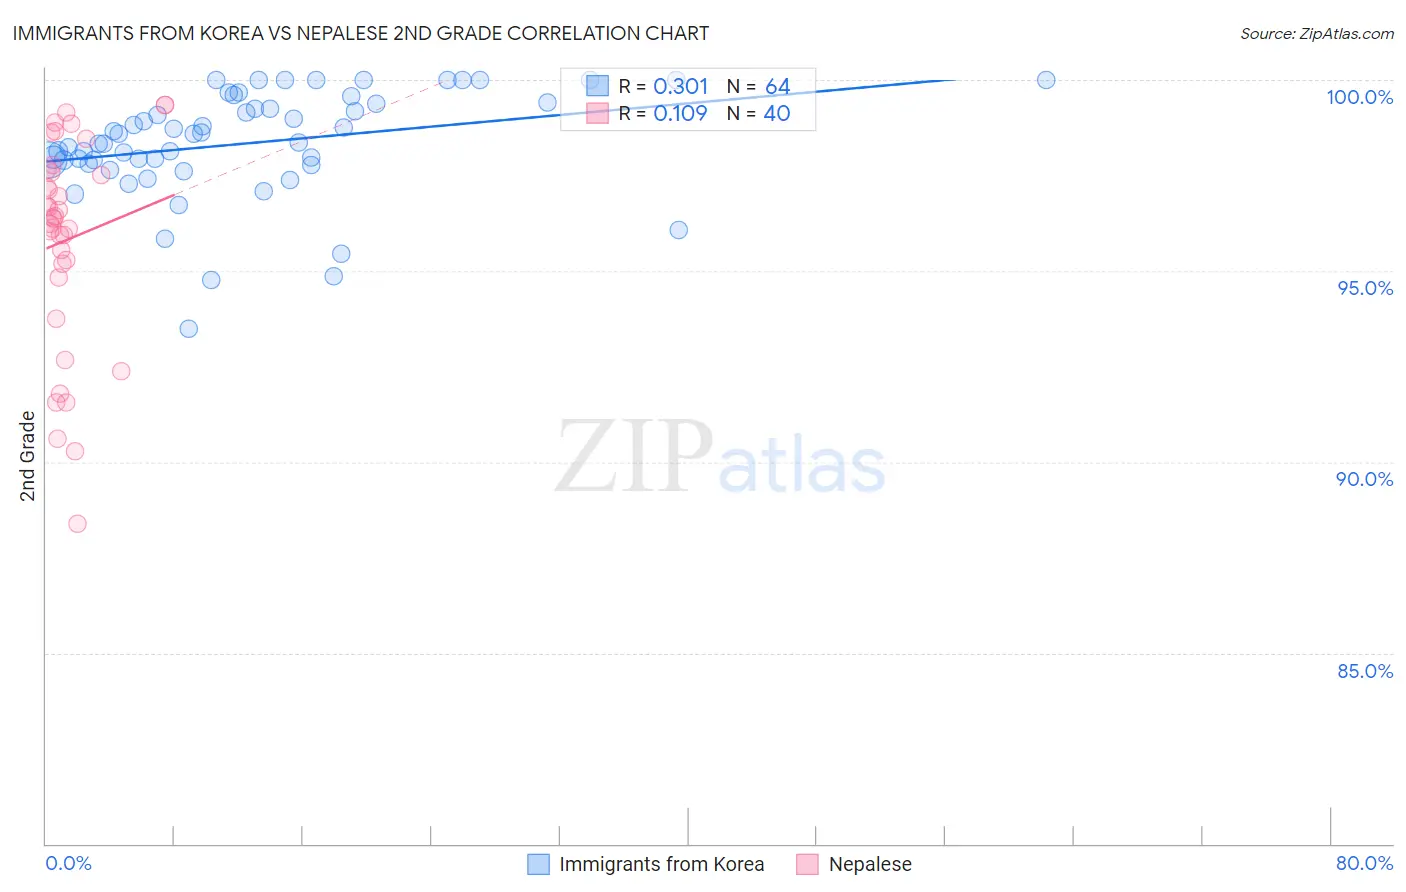
Immigrants from Korea vs Nepalese 2nd Grade Correlation Chart
The statistical analysis conducted on geographies consisting of 416,280,076 people shows a mild positive correlation between the proportion of Immigrants from Korea and percentage of population with at least 2nd grade education in the United States with a correlation coefficient (R) of 0.301 and weighted average of 97.9%. Similarly, the statistical analysis conducted on geographies consisting of 24,521,755 people shows a poor positive correlation between the proportion of Nepalese and percentage of population with at least 2nd grade education in the United States with a correlation coefficient (R) of 0.109 and weighted average of 96.1%, a difference of 1.9%.
2nd Grade Correlation Summary
| Measurement | Immigrants from Korea | Nepalese |
| Minimum | 93.5% | 88.4% |
| Maximum | 100.0% | 99.3% |
| Range | 6.5% | 11.0% |
| Mean | 98.3% | 95.8% |
| Median | 98.5% | 96.4% |
| Interquartile 25% (IQ1) | 97.8% | 95.0% |
| Interquartile 75% (IQ3) | 99.4% | 97.6% |
| Interquartile Range (IQR) | 1.6% | 2.6% |
| Standard Deviation (Sample) | 1.4% | 2.7% |
| Standard Deviation (Population) | 1.4% | 2.7% |
Similar Demographics by 2nd Grade
Demographics Similar to Immigrants from Korea by 2nd Grade
In terms of 2nd grade, the demographic groups most similar to Immigrants from Korea are Albanian (97.9%, a difference of 0.0%), Kenyan (97.9%, a difference of 0.0%), Spanish American (97.9%, a difference of 0.010%), Immigrants from Jordan (97.9%, a difference of 0.010%), and Chilean (97.9%, a difference of 0.010%).
| Demographics | Rating | Rank | 2nd Grade |
| Spanish Americans | 56.4 /100 | #165 | Average 97.9% |
| Immigrants | Jordan | 56.3 /100 | #166 | Average 97.9% |
| Chileans | 56.1 /100 | #167 | Average 97.9% |
| Brazilians | 55.8 /100 | #168 | Average 97.9% |
| Immigrants | Spain | 55.4 /100 | #169 | Average 97.9% |
| Navajo | 54.3 /100 | #170 | Average 97.9% |
| Albanians | 52.8 /100 | #171 | Average 97.9% |
| Immigrants | Korea | 52.7 /100 | #172 | Average 97.9% |
| Kenyans | 52.7 /100 | #173 | Average 97.9% |
| Immigrants | Micronesia | 50.0 /100 | #174 | Average 97.9% |
| Immigrants | Bosnia and Herzegovina | 49.8 /100 | #175 | Average 97.9% |
| Immigrants | Sri Lanka | 48.7 /100 | #176 | Average 97.9% |
| Immigrants | Brazil | 46.6 /100 | #177 | Average 97.9% |
| Argentineans | 46.3 /100 | #178 | Average 97.9% |
| Immigrants | Venezuela | 46.1 /100 | #179 | Average 97.9% |
Demographics Similar to Nepalese by 2nd Grade
In terms of 2nd grade, the demographic groups most similar to Nepalese are Salvadoran (96.0%, a difference of 0.040%), Immigrants from Mexico (96.1%, a difference of 0.090%), Immigrants from Central America (96.2%, a difference of 0.11%), Immigrants from Guatemala (96.2%, a difference of 0.13%), and Immigrants from El Salvador (95.9%, a difference of 0.20%).
| Demographics | Rating | Rank | 2nd Grade |
| Immigrants | Dominican Republic | 0.0 /100 | #333 | Tragic 96.4% |
| Central Americans | 0.0 /100 | #334 | Tragic 96.4% |
| Yakama | 0.0 /100 | #335 | Tragic 96.4% |
| Immigrants | Fiji | 0.0 /100 | #336 | Tragic 96.4% |
| Immigrants | Cambodia | 0.0 /100 | #337 | Tragic 96.4% |
| Immigrants | Cabo Verde | 0.0 /100 | #338 | Tragic 96.3% |
| Guatemalans | 0.0 /100 | #339 | Tragic 96.3% |
| Immigrants | Guatemala | 0.0 /100 | #340 | Tragic 96.2% |
| Immigrants | Central America | 0.0 /100 | #341 | Tragic 96.2% |
| Immigrants | Mexico | 0.0 /100 | #342 | Tragic 96.1% |
| Nepalese | 0.0 /100 | #343 | Tragic 96.1% |
| Salvadorans | 0.0 /100 | #344 | Tragic 96.0% |
| Immigrants | El Salvador | 0.0 /100 | #345 | Tragic 95.9% |
| Immigrants | Yemen | 0.0 /100 | #346 | Tragic 95.7% |
| Spanish American Indians | 0.0 /100 | #347 | Tragic 95.6% |