Immigrants from Kenya vs Salvadoran 3rd Grade
COMPARE
Immigrants from Kenya
Salvadoran
3rd Grade
3rd Grade Comparison
Immigrants from Kenya
Salvadorans
97.7%
3RD GRADE
28.2/ 100
METRIC RATING
193rd/ 347
METRIC RANK
95.7%
3RD GRADE
0.0/ 100
METRIC RATING
344th/ 347
METRIC RANK
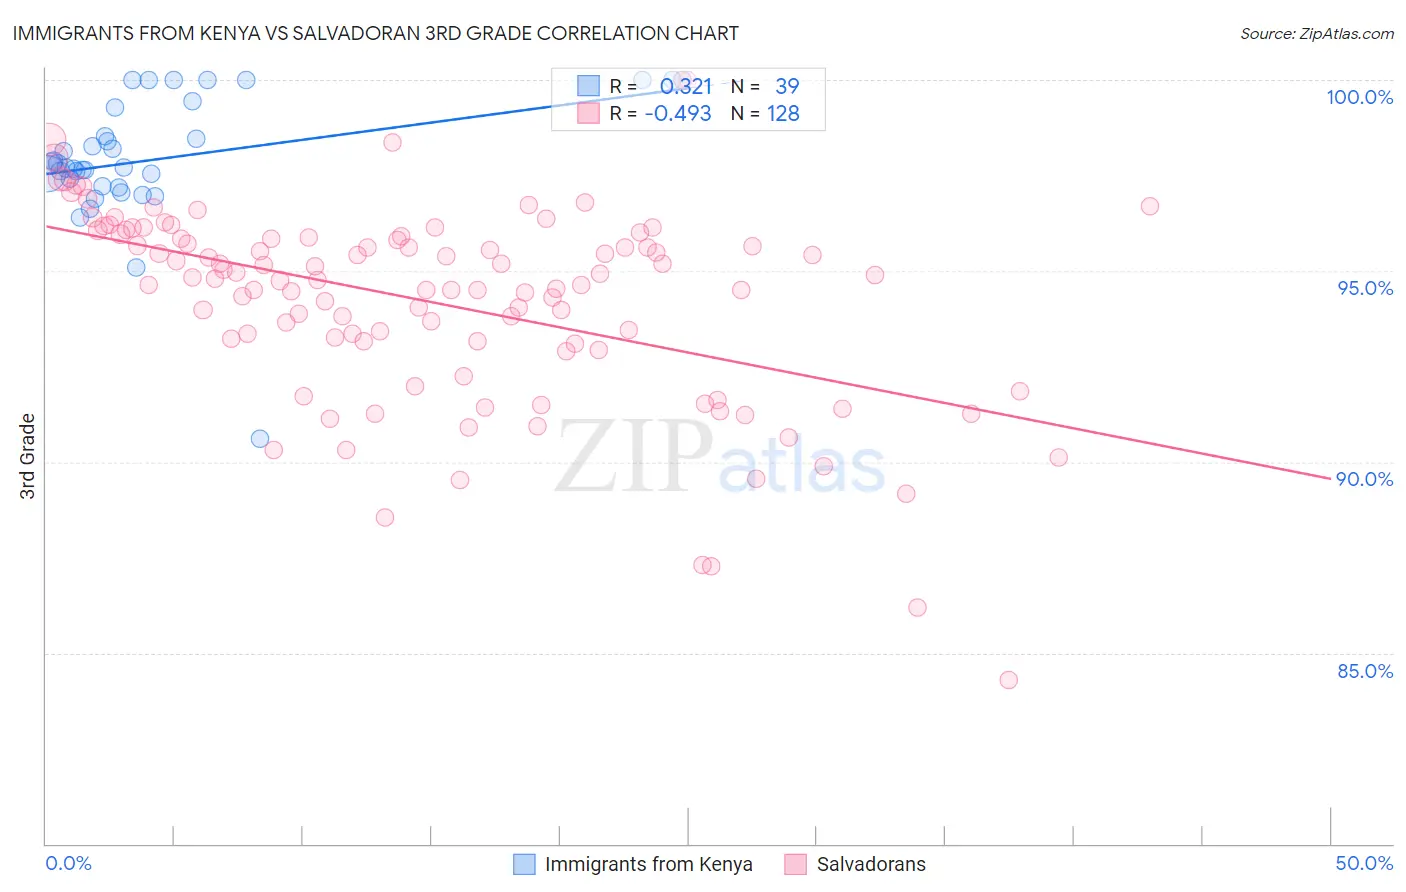
Immigrants from Kenya vs Salvadoran 3rd Grade Correlation Chart
The statistical analysis conducted on geographies consisting of 218,076,690 people shows a mild positive correlation between the proportion of Immigrants from Kenya and percentage of population with at least 3rd grade education in the United States with a correlation coefficient (R) of 0.321 and weighted average of 97.7%. Similarly, the statistical analysis conducted on geographies consisting of 399,068,107 people shows a moderate negative correlation between the proportion of Salvadorans and percentage of population with at least 3rd grade education in the United States with a correlation coefficient (R) of -0.493 and weighted average of 95.7%, a difference of 2.1%.
3rd Grade Correlation Summary
| Measurement | Immigrants from Kenya | Salvadoran |
| Minimum | 90.6% | 84.3% |
| Maximum | 100.0% | 100.0% |
| Range | 9.4% | 15.7% |
| Mean | 97.9% | 94.2% |
| Median | 97.7% | 94.8% |
| Interquartile 25% (IQ1) | 97.2% | 93.1% |
| Interquartile 75% (IQ3) | 99.3% | 95.9% |
| Interquartile Range (IQR) | 2.1% | 2.8% |
| Standard Deviation (Sample) | 1.7% | 2.6% |
| Standard Deviation (Population) | 1.7% | 2.6% |
Similar Demographics by 3rd Grade
Demographics Similar to Immigrants from Kenya by 3rd Grade
In terms of 3rd grade, the demographic groups most similar to Immigrants from Kenya are Mongolian (97.7%, a difference of 0.0%), Immigrants from Uganda (97.7%, a difference of 0.0%), Panamanian (97.7%, a difference of 0.010%), Black/African American (97.7%, a difference of 0.010%), and Immigrants from Egypt (97.7%, a difference of 0.010%).
| Demographics | Rating | Rank | 3rd Grade |
| Portuguese | 36.2 /100 | #186 | Fair 97.7% |
| Natives/Alaskans | 35.2 /100 | #187 | Fair 97.7% |
| Immigrants | Taiwan | 34.2 /100 | #188 | Fair 97.7% |
| Pakistanis | 34.2 /100 | #189 | Fair 97.7% |
| Panamanians | 31.5 /100 | #190 | Fair 97.7% |
| Blacks/African Americans | 29.6 /100 | #191 | Fair 97.7% |
| Mongolians | 29.1 /100 | #192 | Fair 97.7% |
| Immigrants | Kenya | 28.2 /100 | #193 | Fair 97.7% |
| Immigrants | Uganda | 27.4 /100 | #194 | Fair 97.7% |
| Immigrants | Egypt | 26.8 /100 | #195 | Fair 97.7% |
| Paraguayans | 26.2 /100 | #196 | Fair 97.7% |
| Hawaiians | 25.7 /100 | #197 | Fair 97.7% |
| Guamanians/Chamorros | 23.6 /100 | #198 | Fair 97.7% |
| Immigrants | Ukraine | 22.7 /100 | #199 | Fair 97.7% |
| Immigrants | Albania | 22.6 /100 | #200 | Fair 97.7% |
Demographics Similar to Salvadorans by 3rd Grade
In terms of 3rd grade, the demographic groups most similar to Salvadorans are Immigrants from Mexico (95.8%, a difference of 0.11%), Immigrants from Yemen (95.6%, a difference of 0.13%), Immigrants from Central America (95.8%, a difference of 0.14%), Immigrants from Guatemala (95.8%, a difference of 0.14%), and Immigrants from El Salvador (95.5%, a difference of 0.19%).
| Demographics | Rating | Rank | 3rd Grade |
| Immigrants | Fiji | 0.0 /100 | #333 | Tragic 96.2% |
| Immigrants | Cambodia | 0.0 /100 | #334 | Tragic 96.2% |
| Immigrants | Dominican Republic | 0.0 /100 | #335 | Tragic 96.2% |
| Immigrants | Cabo Verde | 0.0 /100 | #336 | Tragic 96.2% |
| Central Americans | 0.0 /100 | #337 | Tragic 96.1% |
| Guatemalans | 0.0 /100 | #338 | Tragic 96.0% |
| Yakama | 0.0 /100 | #339 | Tragic 95.9% |
| Nepalese | 0.0 /100 | #340 | Tragic 95.9% |
| Immigrants | Central America | 0.0 /100 | #341 | Tragic 95.8% |
| Immigrants | Guatemala | 0.0 /100 | #342 | Tragic 95.8% |
| Immigrants | Mexico | 0.0 /100 | #343 | Tragic 95.8% |
| Salvadorans | 0.0 /100 | #344 | Tragic 95.7% |
| Immigrants | Yemen | 0.0 /100 | #345 | Tragic 95.6% |
| Immigrants | El Salvador | 0.0 /100 | #346 | Tragic 95.5% |
| Spanish American Indians | 0.0 /100 | #347 | Tragic 95.3% |