Immigrants from Jordan vs Lithuanian 8th Grade
COMPARE
Immigrants from Jordan
Lithuanian
8th Grade
8th Grade Comparison
Immigrants from Jordan
Lithuanians
95.9%
8TH GRADE
79.5/ 100
METRIC RATING
153rd/ 347
METRIC RANK
97.3%
8TH GRADE
100.0/ 100
METRIC RATING
18th/ 347
METRIC RANK
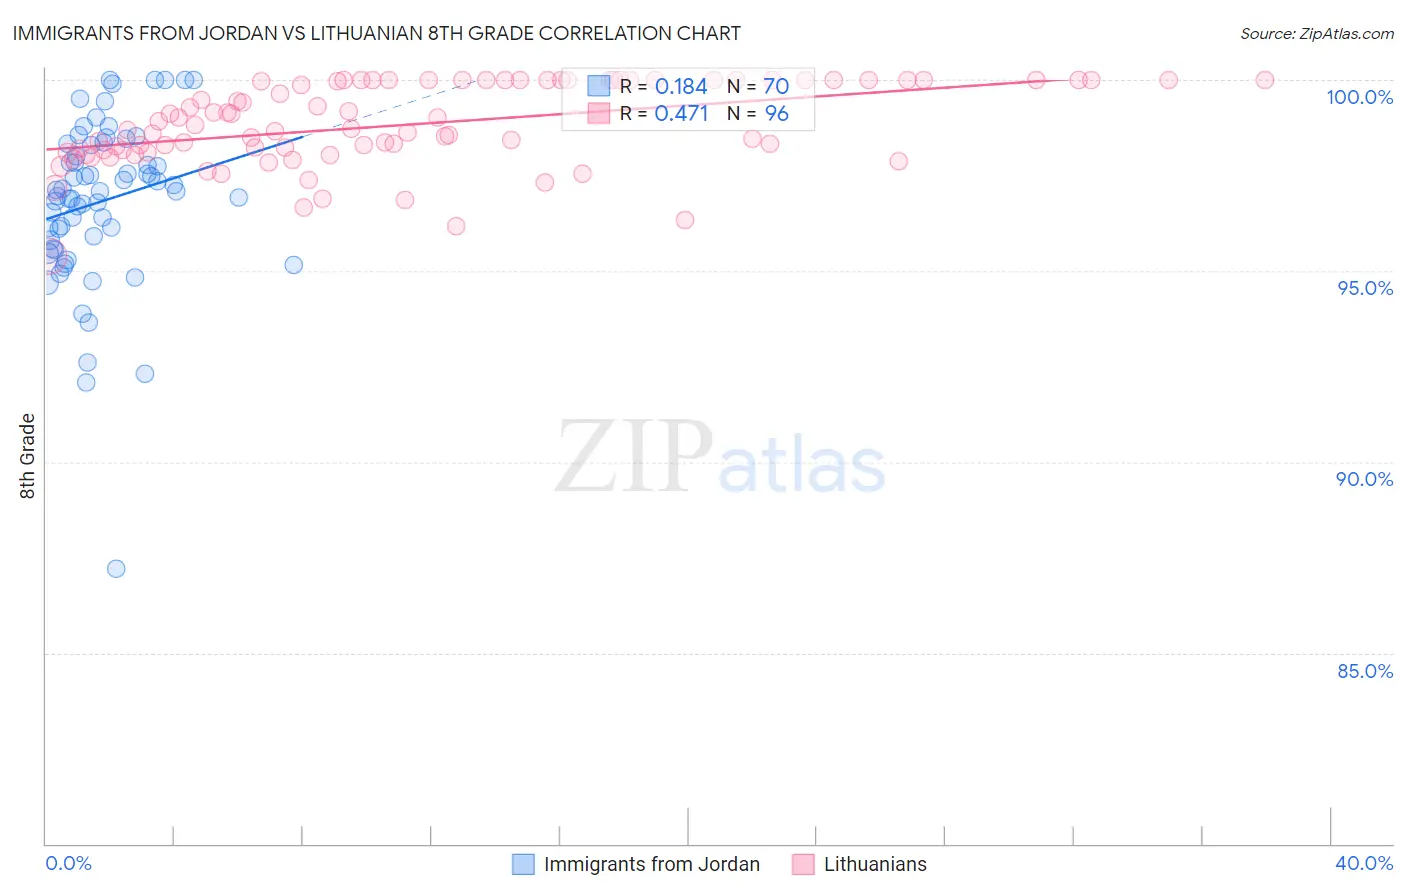
Immigrants from Jordan vs Lithuanian 8th Grade Correlation Chart
The statistical analysis conducted on geographies consisting of 181,269,353 people shows a poor positive correlation between the proportion of Immigrants from Jordan and percentage of population with at least 8th grade education in the United States with a correlation coefficient (R) of 0.184 and weighted average of 95.9%. Similarly, the statistical analysis conducted on geographies consisting of 421,948,041 people shows a moderate positive correlation between the proportion of Lithuanians and percentage of population with at least 8th grade education in the United States with a correlation coefficient (R) of 0.471 and weighted average of 97.3%, a difference of 1.4%.
8th Grade Correlation Summary
| Measurement | Immigrants from Jordan | Lithuanian |
| Minimum | 87.2% | 95.4% |
| Maximum | 100.0% | 100.0% |
| Range | 12.8% | 4.6% |
| Mean | 96.8% | 98.8% |
| Median | 97.1% | 98.8% |
| Interquartile 25% (IQ1) | 95.8% | 98.1% |
| Interquartile 75% (IQ3) | 98.3% | 100.0% |
| Interquartile Range (IQR) | 2.5% | 1.9% |
| Standard Deviation (Sample) | 2.2% | 1.1% |
| Standard Deviation (Population) | 2.1% | 1.1% |
Similar Demographics by 8th Grade
Demographics Similar to Immigrants from Jordan by 8th Grade
In terms of 8th grade, the demographic groups most similar to Immigrants from Jordan are Hopi (95.9%, a difference of 0.0%), Immigrants from Russia (96.0%, a difference of 0.010%), Blackfeet (96.0%, a difference of 0.010%), French American Indian (96.0%, a difference of 0.010%), and Immigrants from Israel (96.0%, a difference of 0.020%).
| Demographics | Rating | Rank | 8th Grade |
| Israelis | 84.1 /100 | #146 | Excellent 96.0% |
| Colville | 84.0 /100 | #147 | Excellent 96.0% |
| Albanians | 83.1 /100 | #148 | Excellent 96.0% |
| Immigrants | Israel | 81.3 /100 | #149 | Excellent 96.0% |
| Immigrants | Russia | 80.9 /100 | #150 | Excellent 96.0% |
| Blackfeet | 80.8 /100 | #151 | Excellent 96.0% |
| French American Indians | 80.6 /100 | #152 | Excellent 96.0% |
| Immigrants | Jordan | 79.5 /100 | #153 | Good 95.9% |
| Hopi | 79.4 /100 | #154 | Good 95.9% |
| Kenyans | 74.5 /100 | #155 | Good 95.9% |
| Ugandans | 74.1 /100 | #156 | Good 95.9% |
| Immigrants | Taiwan | 70.5 /100 | #157 | Good 95.9% |
| Arabs | 69.4 /100 | #158 | Good 95.9% |
| Immigrants | Kazakhstan | 68.4 /100 | #159 | Good 95.9% |
| Seminole | 67.7 /100 | #160 | Good 95.8% |
Demographics Similar to Lithuanians by 8th Grade
In terms of 8th grade, the demographic groups most similar to Lithuanians are Irish (97.3%, a difference of 0.010%), Scottish (97.3%, a difference of 0.010%), Tlingit-Haida (97.3%, a difference of 0.020%), Pennsylvania German (97.3%, a difference of 0.050%), and Alaskan Athabascan (97.3%, a difference of 0.060%).
| Demographics | Rating | Rank | 8th Grade |
| Poles | 100.0 /100 | #11 | Exceptional 97.4% |
| Swedes | 100.0 /100 | #12 | Exceptional 97.4% |
| Alaskan Athabascans | 100.0 /100 | #13 | Exceptional 97.3% |
| English | 100.0 /100 | #14 | Exceptional 97.3% |
| Pennsylvania Germans | 100.0 /100 | #15 | Exceptional 97.3% |
| Tlingit-Haida | 100.0 /100 | #16 | Exceptional 97.3% |
| Irish | 100.0 /100 | #17 | Exceptional 97.3% |
| Lithuanians | 100.0 /100 | #18 | Exceptional 97.3% |
| Scottish | 100.0 /100 | #19 | Exceptional 97.3% |
| Croatians | 100.0 /100 | #20 | Exceptional 97.2% |
| Danes | 100.0 /100 | #21 | Exceptional 97.2% |
| Welsh | 100.0 /100 | #22 | Exceptional 97.2% |
| French Canadians | 100.0 /100 | #23 | Exceptional 97.2% |
| Scandinavians | 100.0 /100 | #24 | Exceptional 97.2% |
| Czechs | 100.0 /100 | #25 | Exceptional 97.1% |