Immigrants from Japan vs Soviet Union 3rd Grade
COMPARE
Immigrants from Japan
Soviet Union
3rd Grade
3rd Grade Comparison
Immigrants from Japan
Soviet Union
98.0%
3RD GRADE
93.7/ 100
METRIC RATING
124th/ 347
METRIC RANK
97.8%
3RD GRADE
72.6/ 100
METRIC RATING
151st/ 347
METRIC RANK
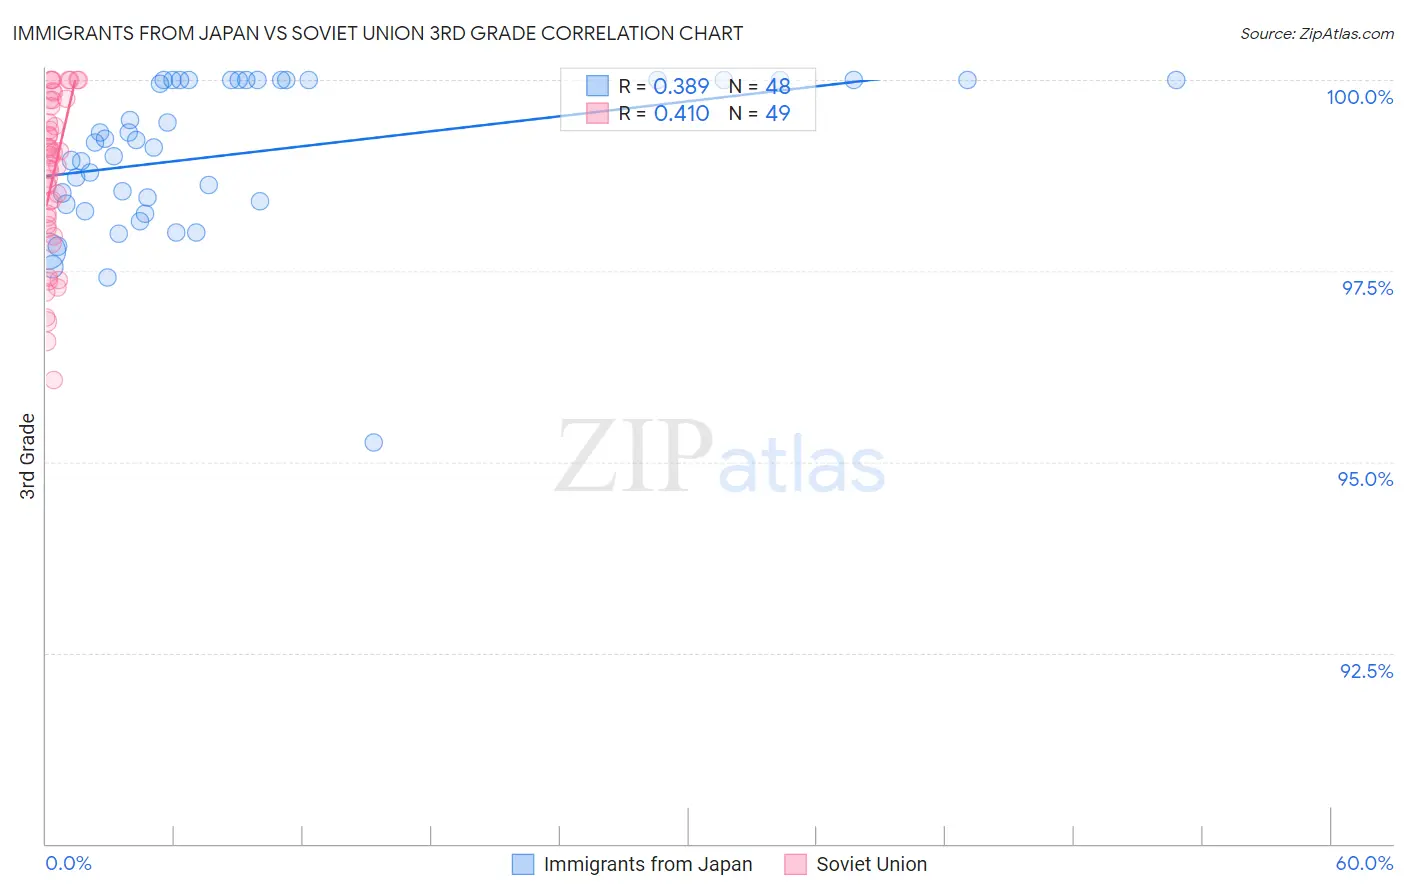
Immigrants from Japan vs Soviet Union 3rd Grade Correlation Chart
The statistical analysis conducted on geographies consisting of 340,148,851 people shows a mild positive correlation between the proportion of Immigrants from Japan and percentage of population with at least 3rd grade education in the United States with a correlation coefficient (R) of 0.389 and weighted average of 98.0%. Similarly, the statistical analysis conducted on geographies consisting of 43,454,395 people shows a moderate positive correlation between the proportion of Soviet Union and percentage of population with at least 3rd grade education in the United States with a correlation coefficient (R) of 0.410 and weighted average of 97.8%, a difference of 0.15%.
3rd Grade Correlation Summary
| Measurement | Immigrants from Japan | Soviet Union |
| Minimum | 95.3% | 96.1% |
| Maximum | 100.0% | 100.0% |
| Range | 4.7% | 3.9% |
| Mean | 99.0% | 98.7% |
| Median | 99.2% | 99.0% |
| Interquartile 25% (IQ1) | 98.4% | 98.1% |
| Interquartile 75% (IQ3) | 100.0% | 99.7% |
| Interquartile Range (IQR) | 1.6% | 1.6% |
| Standard Deviation (Sample) | 1.00% | 1.0% |
| Standard Deviation (Population) | 0.99% | 1.0% |
Similar Demographics by 3rd Grade
Demographics Similar to Immigrants from Japan by 3rd Grade
In terms of 3rd grade, the demographic groups most similar to Immigrants from Japan are Syrian (98.0%, a difference of 0.0%), Immigrants from Saudi Arabia (98.0%, a difference of 0.0%), Immigrants from Zimbabwe (98.0%, a difference of 0.0%), Immigrants from Croatia (98.0%, a difference of 0.010%), and Iroquois (98.0%, a difference of 0.010%).
| Demographics | Rating | Rank | 3rd Grade |
| Immigrants | France | 95.1 /100 | #117 | Exceptional 98.0% |
| Iranians | 94.9 /100 | #118 | Exceptional 98.0% |
| Spanish | 94.8 /100 | #119 | Exceptional 98.0% |
| Immigrants | Croatia | 94.4 /100 | #120 | Exceptional 98.0% |
| Iroquois | 94.1 /100 | #121 | Exceptional 98.0% |
| Lebanese | 94.1 /100 | #122 | Exceptional 98.0% |
| Syrians | 93.8 /100 | #123 | Exceptional 98.0% |
| Immigrants | Japan | 93.7 /100 | #124 | Exceptional 98.0% |
| Immigrants | Saudi Arabia | 93.5 /100 | #125 | Exceptional 98.0% |
| Immigrants | Zimbabwe | 93.4 /100 | #126 | Exceptional 98.0% |
| Ute | 93.2 /100 | #127 | Exceptional 98.0% |
| Colville | 92.1 /100 | #128 | Exceptional 98.0% |
| Immigrants | Serbia | 91.9 /100 | #129 | Exceptional 98.0% |
| Immigrants | Europe | 91.2 /100 | #130 | Exceptional 98.0% |
| Immigrants | Bulgaria | 89.1 /100 | #131 | Excellent 97.9% |
Demographics Similar to Soviet Union by 3rd Grade
In terms of 3rd grade, the demographic groups most similar to Soviet Union are Immigrants from North Macedonia (97.8%, a difference of 0.010%), Jordanian (97.8%, a difference of 0.010%), Immigrants from South Central Asia (97.8%, a difference of 0.010%), Immigrants from Israel (97.9%, a difference of 0.020%), and Immigrants from Moldova (97.9%, a difference of 0.020%).
| Demographics | Rating | Rank | 3rd Grade |
| Burmese | 79.6 /100 | #144 | Good 97.9% |
| Immigrants | Greece | 79.5 /100 | #145 | Good 97.9% |
| Alsatians | 78.3 /100 | #146 | Good 97.9% |
| Immigrants | Israel | 77.3 /100 | #147 | Good 97.9% |
| Immigrants | Moldova | 77.1 /100 | #148 | Good 97.9% |
| Immigrants | North Macedonia | 74.5 /100 | #149 | Good 97.8% |
| Jordanians | 74.5 /100 | #150 | Good 97.8% |
| Soviet Union | 72.6 /100 | #151 | Good 97.8% |
| Immigrants | South Central Asia | 69.5 /100 | #152 | Good 97.8% |
| Apache | 68.5 /100 | #153 | Good 97.8% |
| Immigrants | Eastern Europe | 64.1 /100 | #154 | Good 97.8% |
| Bermudans | 62.6 /100 | #155 | Good 97.8% |
| Immigrants | Russia | 61.7 /100 | #156 | Good 97.8% |
| Immigrants | Italy | 61.2 /100 | #157 | Good 97.8% |
| Venezuelans | 60.9 /100 | #158 | Good 97.8% |