Immigrants from Japan vs Peruvian No Schooling Completed
COMPARE
Immigrants from Japan
Peruvian
No Schooling Completed
No Schooling Completed Comparison
Immigrants from Japan
Peruvians
1.9%
NO SCHOOLING COMPLETED
96.6/ 100
METRIC RATING
111th/ 347
METRIC RANK
2.4%
NO SCHOOLING COMPLETED
1.4/ 100
METRIC RATING
244th/ 347
METRIC RANK
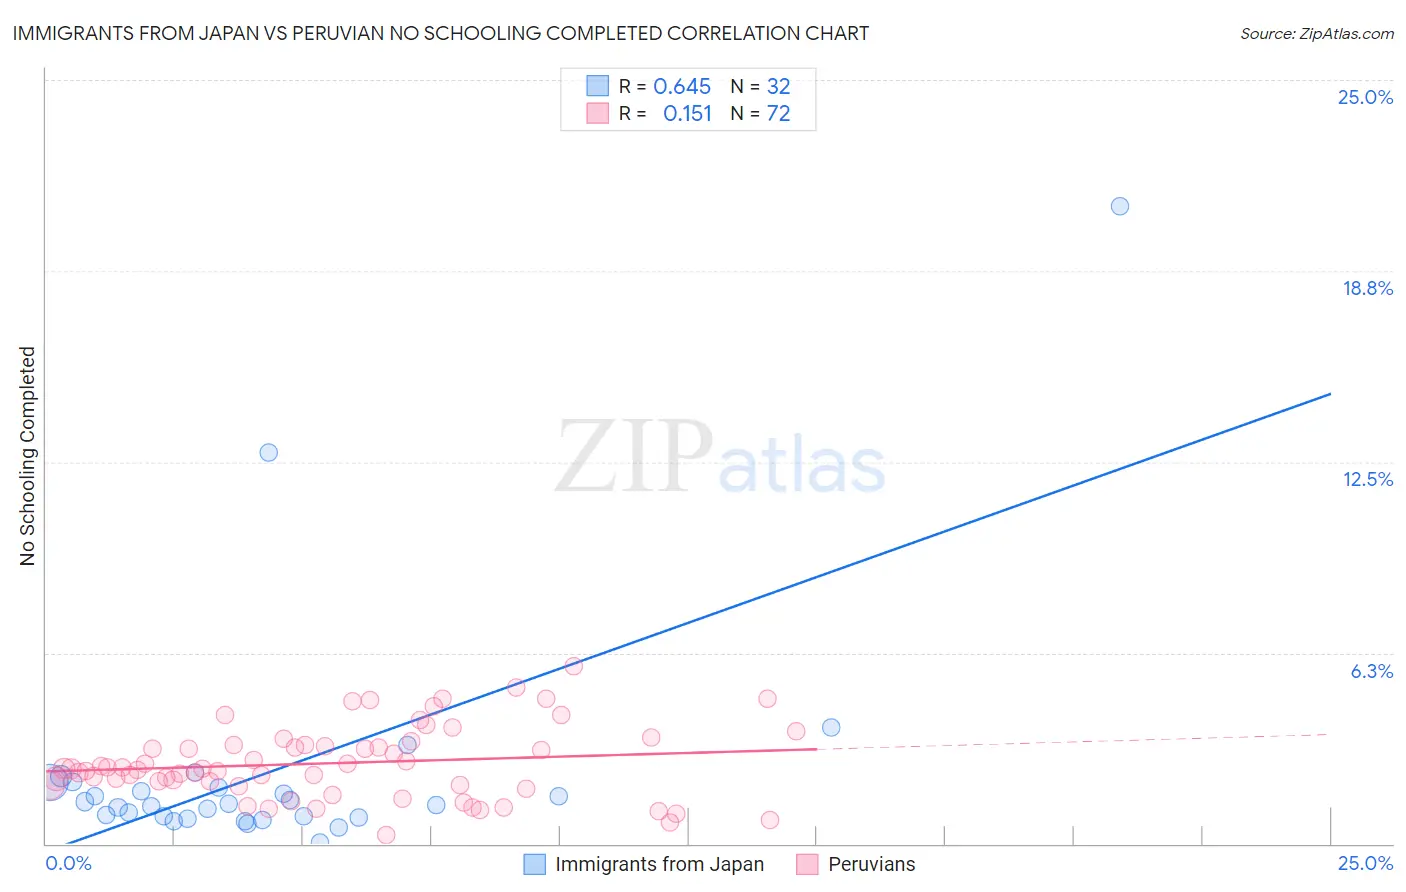
Immigrants from Japan vs Peruvian No Schooling Completed Correlation Chart
The statistical analysis conducted on geographies consisting of 337,168,238 people shows a significant positive correlation between the proportion of Immigrants from Japan and percentage of population with no schooling in the United States with a correlation coefficient (R) of 0.645 and weighted average of 1.9%. Similarly, the statistical analysis conducted on geographies consisting of 360,290,291 people shows a poor positive correlation between the proportion of Peruvians and percentage of population with no schooling in the United States with a correlation coefficient (R) of 0.151 and weighted average of 2.4%, a difference of 28.6%.
No Schooling Completed Correlation Summary
| Measurement | Immigrants from Japan | Peruvian |
| Minimum | 0.022% | 0.29% |
| Maximum | 20.9% | 5.8% |
| Range | 20.9% | 5.5% |
| Mean | 2.4% | 2.6% |
| Median | 1.3% | 2.4% |
| Interquartile 25% (IQ1) | 0.88% | 1.9% |
| Interquartile 75% (IQ3) | 1.9% | 3.2% |
| Interquartile Range (IQR) | 1.0% | 1.3% |
| Standard Deviation (Sample) | 4.0% | 1.2% |
| Standard Deviation (Population) | 3.9% | 1.2% |
Similar Demographics by No Schooling Completed
Demographics Similar to Immigrants from Japan by No Schooling Completed
In terms of no schooling completed, the demographic groups most similar to Immigrants from Japan are Immigrants from Latvia (1.9%, a difference of 0.15%), Pueblo (1.9%, a difference of 0.19%), Immigrants from Saudi Arabia (1.9%, a difference of 0.28%), Immigrants from Zimbabwe (1.9%, a difference of 0.43%), and Immigrants from Norway (1.9%, a difference of 0.44%).
| Demographics | Rating | Rank | No Schooling Completed |
| Thais | 97.5 /100 | #104 | Exceptional 1.8% |
| German Russians | 97.5 /100 | #105 | Exceptional 1.8% |
| Immigrants | France | 97.3 /100 | #106 | Exceptional 1.8% |
| Yugoslavians | 97.2 /100 | #107 | Exceptional 1.8% |
| Okinawans | 97.1 /100 | #108 | Exceptional 1.8% |
| Immigrants | Saudi Arabia | 96.8 /100 | #109 | Exceptional 1.9% |
| Immigrants | Latvia | 96.7 /100 | #110 | Exceptional 1.9% |
| Immigrants | Japan | 96.6 /100 | #111 | Exceptional 1.9% |
| Pueblo | 96.4 /100 | #112 | Exceptional 1.9% |
| Immigrants | Zimbabwe | 96.2 /100 | #113 | Exceptional 1.9% |
| Immigrants | Norway | 96.1 /100 | #114 | Exceptional 1.9% |
| Syrians | 96.0 /100 | #115 | Exceptional 1.9% |
| Lebanese | 96.0 /100 | #116 | Exceptional 1.9% |
| Immigrants | Serbia | 95.8 /100 | #117 | Exceptional 1.9% |
| Spanish | 95.5 /100 | #118 | Exceptional 1.9% |
Demographics Similar to Peruvians by No Schooling Completed
In terms of no schooling completed, the demographic groups most similar to Peruvians are Bolivian (2.4%, a difference of 0.010%), Immigrants from Congo (2.4%, a difference of 0.050%), South American (2.4%, a difference of 0.11%), Immigrants from Indonesia (2.4%, a difference of 0.14%), and Immigrants from Iraq (2.4%, a difference of 0.16%).
| Demographics | Rating | Rank | No Schooling Completed |
| Immigrants | Eastern Asia | 2.0 /100 | #237 | Tragic 2.4% |
| Paiute | 1.9 /100 | #238 | Tragic 2.4% |
| Liberians | 1.8 /100 | #239 | Tragic 2.4% |
| Immigrants | Senegal | 1.7 /100 | #240 | Tragic 2.4% |
| Koreans | 1.7 /100 | #241 | Tragic 2.4% |
| Immigrants | Indonesia | 1.5 /100 | #242 | Tragic 2.4% |
| South Americans | 1.5 /100 | #243 | Tragic 2.4% |
| Peruvians | 1.4 /100 | #244 | Tragic 2.4% |
| Bolivians | 1.4 /100 | #245 | Tragic 2.4% |
| Immigrants | Congo | 1.4 /100 | #246 | Tragic 2.4% |
| Immigrants | Iraq | 1.3 /100 | #247 | Tragic 2.4% |
| Asians | 1.2 /100 | #248 | Tragic 2.4% |
| Jamaicans | 1.2 /100 | #249 | Tragic 2.4% |
| Immigrants | Middle Africa | 1.1 /100 | #250 | Tragic 2.4% |
| Immigrants | Africa | 1.1 /100 | #251 | Tragic 2.4% |