Immigrants from Jamaica vs Pima 7th Grade
COMPARE
Immigrants from Jamaica
Pima
7th Grade
7th Grade Comparison
Immigrants from Jamaica
Pima
95.4%
7TH GRADE
0.9/ 100
METRIC RATING
251st/ 347
METRIC RANK
96.1%
7TH GRADE
64.3/ 100
METRIC RATING
162nd/ 347
METRIC RANK
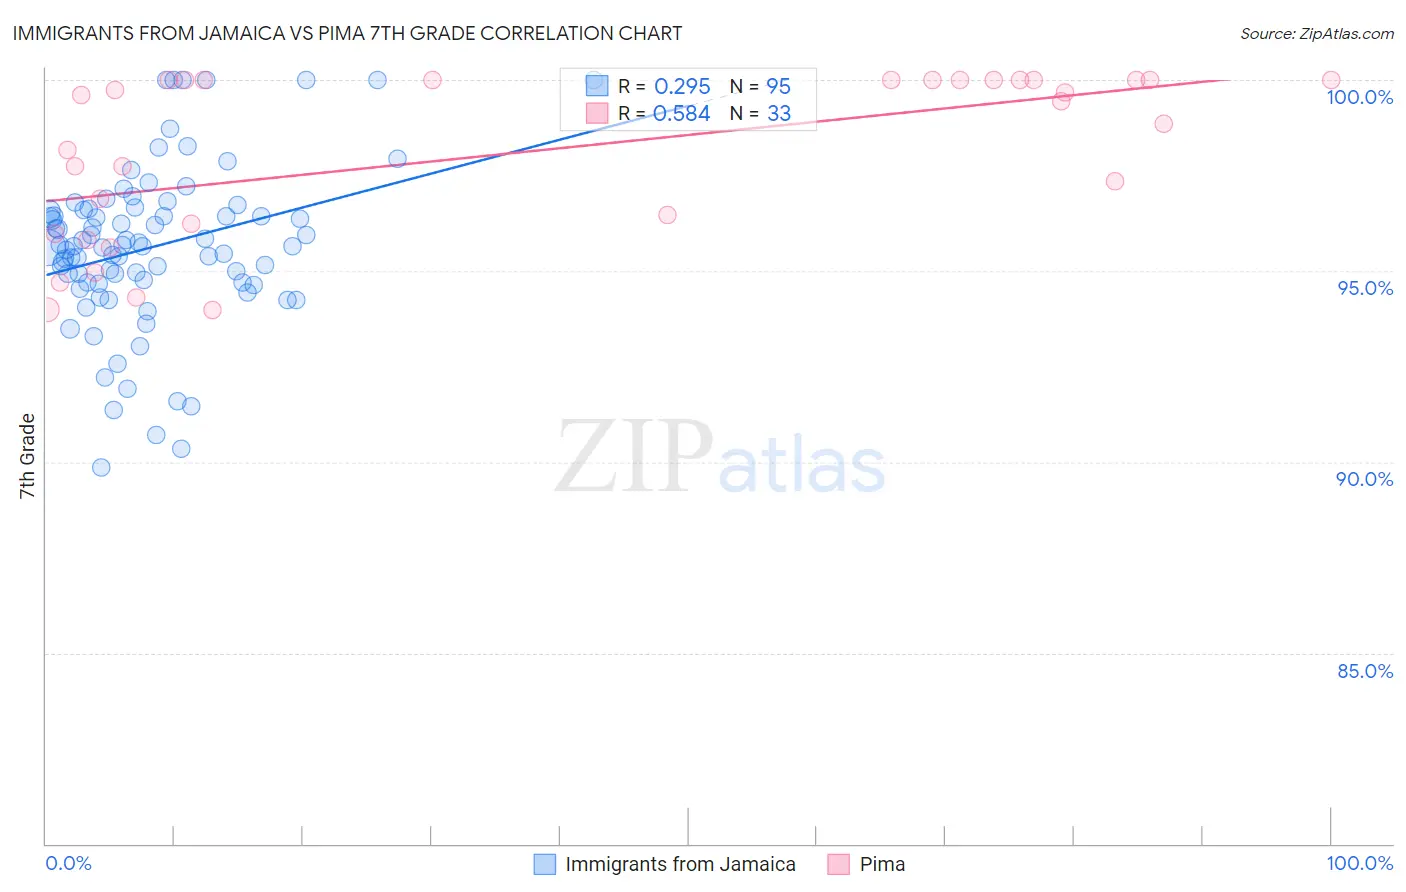
Immigrants from Jamaica vs Pima 7th Grade Correlation Chart
The statistical analysis conducted on geographies consisting of 301,829,550 people shows a weak positive correlation between the proportion of Immigrants from Jamaica and percentage of population with at least 7th grade education in the United States with a correlation coefficient (R) of 0.295 and weighted average of 95.4%. Similarly, the statistical analysis conducted on geographies consisting of 61,552,136 people shows a substantial positive correlation between the proportion of Pima and percentage of population with at least 7th grade education in the United States with a correlation coefficient (R) of 0.584 and weighted average of 96.1%, a difference of 0.81%.
7th Grade Correlation Summary
| Measurement | Immigrants from Jamaica | Pima |
| Minimum | 89.9% | 94.0% |
| Maximum | 100.0% | 100.0% |
| Range | 10.1% | 6.0% |
| Mean | 95.6% | 98.1% |
| Median | 95.6% | 99.4% |
| Interquartile 25% (IQ1) | 94.7% | 96.1% |
| Interquartile 75% (IQ3) | 96.6% | 100.0% |
| Interquartile Range (IQR) | 1.9% | 3.9% |
| Standard Deviation (Sample) | 2.1% | 2.2% |
| Standard Deviation (Population) | 2.1% | 2.1% |
Similar Demographics by 7th Grade
Demographics Similar to Immigrants from Jamaica by 7th Grade
In terms of 7th grade, the demographic groups most similar to Immigrants from Jamaica are Immigrants from Cameroon (95.4%, a difference of 0.0%), Immigrants from Ethiopia (95.3%, a difference of 0.0%), Somali (95.3%, a difference of 0.010%), Bolivian (95.4%, a difference of 0.020%), and Colombian (95.3%, a difference of 0.020%).
| Demographics | Rating | Rank | 7th Grade |
| Uruguayans | 1.6 /100 | #244 | Tragic 95.4% |
| Immigrants | Middle Africa | 1.5 /100 | #245 | Tragic 95.4% |
| Ethiopians | 1.5 /100 | #246 | Tragic 95.4% |
| Tongans | 1.3 /100 | #247 | Tragic 95.4% |
| Paiute | 1.2 /100 | #248 | Tragic 95.4% |
| Bolivians | 1.1 /100 | #249 | Tragic 95.4% |
| Immigrants | Cameroon | 0.9 /100 | #250 | Tragic 95.4% |
| Immigrants | Jamaica | 0.9 /100 | #251 | Tragic 95.4% |
| Immigrants | Ethiopia | 0.9 /100 | #252 | Tragic 95.3% |
| Somalis | 0.9 /100 | #253 | Tragic 95.3% |
| Colombians | 0.8 /100 | #254 | Tragic 95.3% |
| Koreans | 0.8 /100 | #255 | Tragic 95.3% |
| Immigrants | China | 0.7 /100 | #256 | Tragic 95.3% |
| Immigrants | Congo | 0.7 /100 | #257 | Tragic 95.3% |
| Ghanaians | 0.7 /100 | #258 | Tragic 95.3% |
Demographics Similar to Pima by 7th Grade
In terms of 7th grade, the demographic groups most similar to Pima are Bermudan (96.1%, a difference of 0.010%), Spaniard (96.1%, a difference of 0.010%), Immigrants from Italy (96.1%, a difference of 0.010%), Alsatian (96.1%, a difference of 0.020%), and Immigrants from Kenya (96.1%, a difference of 0.020%).
| Demographics | Rating | Rank | 7th Grade |
| Immigrants | Jordan | 77.0 /100 | #155 | Good 96.2% |
| Kenyans | 76.2 /100 | #156 | Good 96.2% |
| Ugandans | 75.5 /100 | #157 | Good 96.2% |
| Arabs | 68.6 /100 | #158 | Good 96.2% |
| Alsatians | 67.2 /100 | #159 | Good 96.1% |
| Immigrants | Kenya | 66.8 /100 | #160 | Good 96.1% |
| Bermudans | 66.3 /100 | #161 | Good 96.1% |
| Pima | 64.3 /100 | #162 | Good 96.1% |
| Spaniards | 62.6 /100 | #163 | Good 96.1% |
| Immigrants | Italy | 62.1 /100 | #164 | Good 96.1% |
| Immigrants | Taiwan | 61.5 /100 | #165 | Good 96.1% |
| Immigrants | Kazakhstan | 61.0 /100 | #166 | Good 96.1% |
| Immigrants | Sri Lanka | 59.9 /100 | #167 | Average 96.1% |
| Immigrants | Poland | 59.0 /100 | #168 | Average 96.1% |
| Ute | 55.8 /100 | #169 | Average 96.1% |