Immigrants from Italy vs Ukrainian 4th Grade
COMPARE
Immigrants from Italy
Ukrainian
4th Grade
4th Grade Comparison
Immigrants from Italy
Ukrainians
97.6%
4TH GRADE
63.7/ 100
METRIC RATING
159th/ 347
METRIC RANK
98.0%
4TH GRADE
99.2/ 100
METRIC RATING
79th/ 347
METRIC RANK
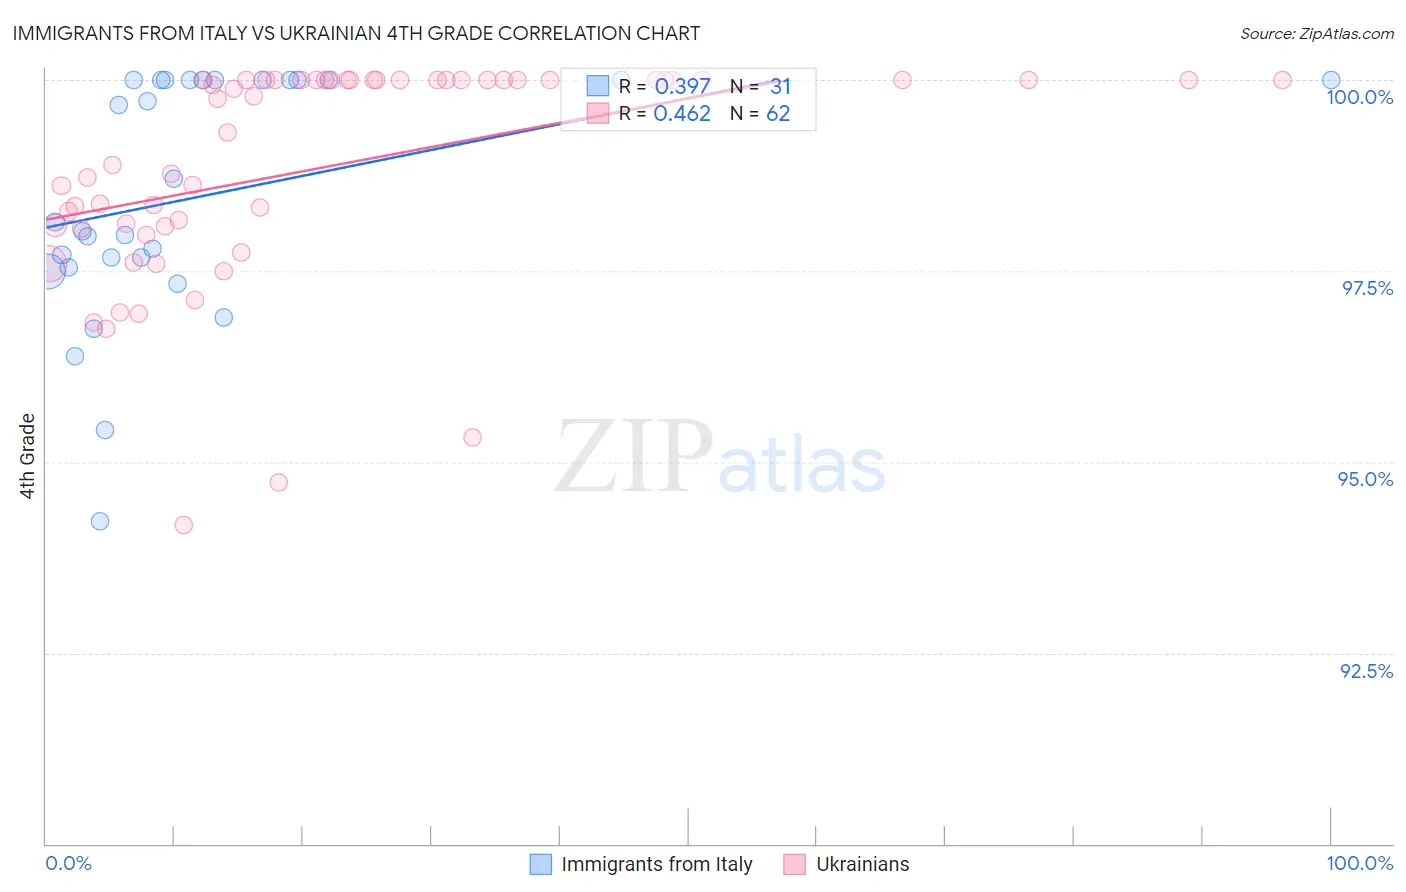
Immigrants from Italy vs Ukrainian 4th Grade Correlation Chart
The statistical analysis conducted on geographies consisting of 324,225,917 people shows a mild positive correlation between the proportion of Immigrants from Italy and percentage of population with at least 4th grade education in the United States with a correlation coefficient (R) of 0.397 and weighted average of 97.6%. Similarly, the statistical analysis conducted on geographies consisting of 448,698,169 people shows a moderate positive correlation between the proportion of Ukrainians and percentage of population with at least 4th grade education in the United States with a correlation coefficient (R) of 0.462 and weighted average of 98.0%, a difference of 0.40%.
4th Grade Correlation Summary
| Measurement | Immigrants from Italy | Ukrainian |
| Minimum | 94.2% | 94.2% |
| Maximum | 100.0% | 100.0% |
| Range | 5.8% | 5.8% |
| Mean | 98.5% | 98.9% |
| Median | 98.1% | 99.8% |
| Interquartile 25% (IQ1) | 97.5% | 98.1% |
| Interquartile 75% (IQ3) | 100.0% | 100.0% |
| Interquartile Range (IQR) | 2.5% | 1.9% |
| Standard Deviation (Sample) | 1.6% | 1.4% |
| Standard Deviation (Population) | 1.6% | 1.4% |
Similar Demographics by 4th Grade
Demographics Similar to Immigrants from Italy by 4th Grade
In terms of 4th grade, the demographic groups most similar to Immigrants from Italy are Immigrants from Russia (97.6%, a difference of 0.010%), Albanian (97.6%, a difference of 0.010%), Immigrants from Jordan (97.6%, a difference of 0.010%), Immigrants from Bosnia and Herzegovina (97.6%, a difference of 0.010%), and French American Indian (97.6%, a difference of 0.010%).
| Demographics | Rating | Rank | 4th Grade |
| Immigrants | South Central Asia | 76.2 /100 | #152 | Good 97.6% |
| Immigrants | Eastern Europe | 71.3 /100 | #153 | Good 97.6% |
| Immigrants | Russia | 67.0 /100 | #154 | Good 97.6% |
| Albanians | 67.0 /100 | #155 | Good 97.6% |
| Immigrants | Jordan | 66.9 /100 | #156 | Good 97.6% |
| Immigrants | Bosnia and Herzegovina | 66.0 /100 | #157 | Good 97.6% |
| French American Indians | 65.9 /100 | #158 | Good 97.6% |
| Immigrants | Italy | 63.7 /100 | #159 | Good 97.6% |
| Apache | 61.3 /100 | #160 | Good 97.6% |
| Marshallese | 60.8 /100 | #161 | Good 97.6% |
| Bermudans | 60.5 /100 | #162 | Good 97.6% |
| Immigrants | Iran | 60.3 /100 | #163 | Good 97.6% |
| Ugandans | 58.9 /100 | #164 | Average 97.6% |
| Venezuelans | 58.7 /100 | #165 | Average 97.6% |
| Kenyans | 56.5 /100 | #166 | Average 97.5% |
Demographics Similar to Ukrainians by 4th Grade
In terms of 4th grade, the demographic groups most similar to Ukrainians are Osage (98.0%, a difference of 0.0%), Immigrants from Netherlands (98.0%, a difference of 0.010%), Cherokee (98.0%, a difference of 0.010%), Immigrants from Lithuania (98.0%, a difference of 0.010%), and Immigrants from England (98.0%, a difference of 0.010%).
| Demographics | Rating | Rank | 4th Grade |
| Iranians | 99.4 /100 | #72 | Exceptional 98.0% |
| Macedonians | 99.4 /100 | #73 | Exceptional 98.0% |
| Chickasaw | 99.4 /100 | #74 | Exceptional 98.0% |
| Immigrants | Netherlands | 99.3 /100 | #75 | Exceptional 98.0% |
| Cherokee | 99.3 /100 | #76 | Exceptional 98.0% |
| Immigrants | Lithuania | 99.3 /100 | #77 | Exceptional 98.0% |
| Immigrants | England | 99.3 /100 | #78 | Exceptional 98.0% |
| Ukrainians | 99.2 /100 | #79 | Exceptional 98.0% |
| Osage | 99.2 /100 | #80 | Exceptional 98.0% |
| Immigrants | India | 99.1 /100 | #81 | Exceptional 98.0% |
| Icelanders | 99.1 /100 | #82 | Exceptional 98.0% |
| Immigrants | Belgium | 99.0 /100 | #83 | Exceptional 97.9% |
| Cypriots | 98.9 /100 | #84 | Exceptional 97.9% |
| Potawatomi | 98.9 /100 | #85 | Exceptional 97.9% |
| Immigrants | Australia | 98.8 /100 | #86 | Exceptional 97.9% |