Immigrants from Italy vs Immigrants from Romania 3rd Grade
COMPARE
Immigrants from Italy
Immigrants from Romania
3rd Grade
3rd Grade Comparison
Immigrants from Italy
Immigrants from Romania
97.8%
3RD GRADE
61.2/ 100
METRIC RATING
157th/ 347
METRIC RANK
97.9%
3RD GRADE
87.9/ 100
METRIC RATING
137th/ 347
METRIC RANK
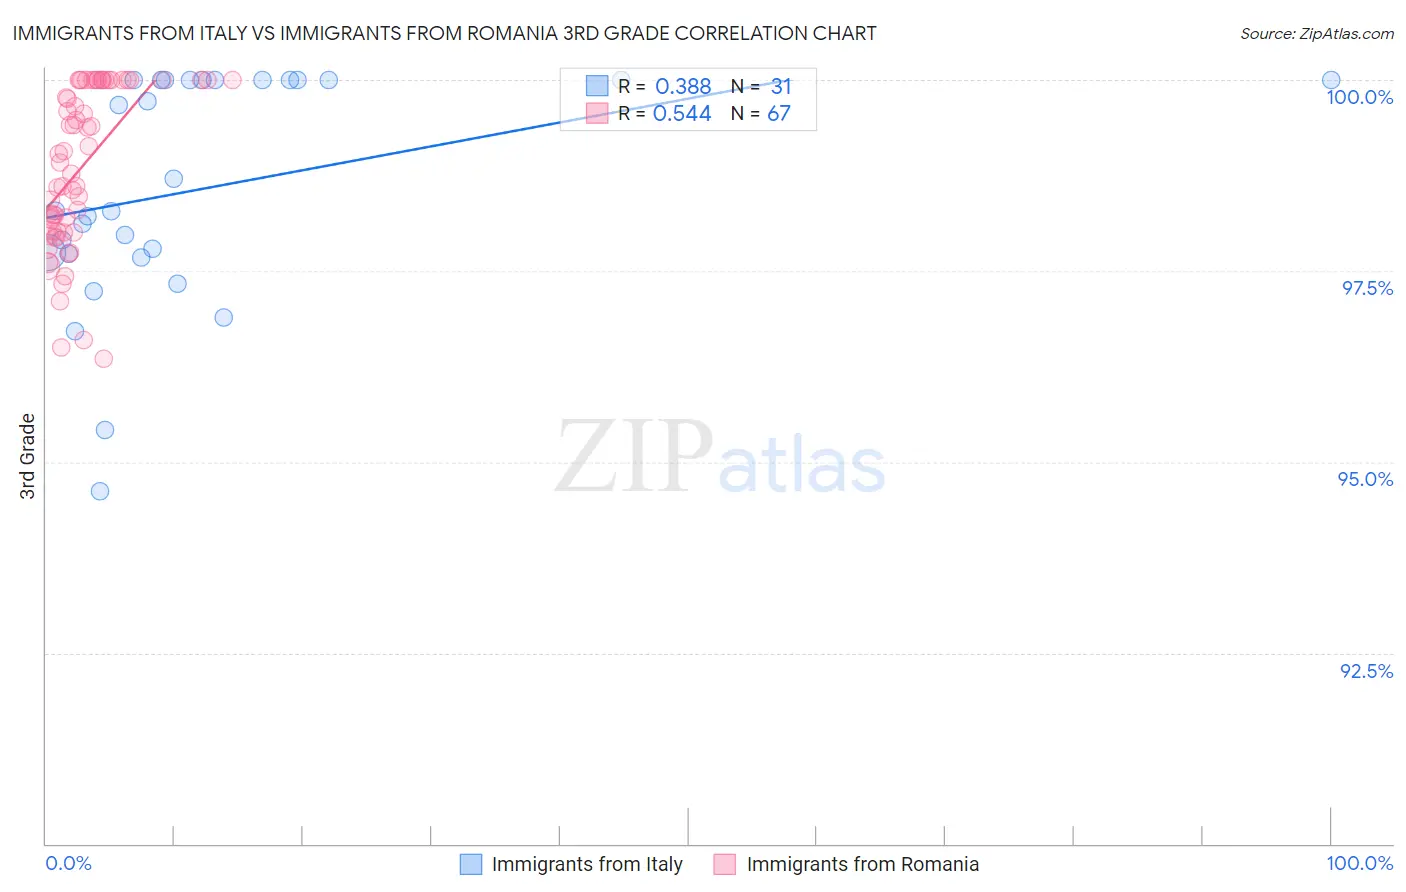
Immigrants from Italy vs Immigrants from Romania 3rd Grade Correlation Chart
The statistical analysis conducted on geographies consisting of 324,225,917 people shows a mild positive correlation between the proportion of Immigrants from Italy and percentage of population with at least 3rd grade education in the United States with a correlation coefficient (R) of 0.388 and weighted average of 97.8%. Similarly, the statistical analysis conducted on geographies consisting of 257,006,599 people shows a substantial positive correlation between the proportion of Immigrants from Romania and percentage of population with at least 3rd grade education in the United States with a correlation coefficient (R) of 0.544 and weighted average of 97.9%, a difference of 0.13%.
3rd Grade Correlation Summary
| Measurement | Immigrants from Italy | Immigrants from Romania |
| Minimum | 94.6% | 96.4% |
| Maximum | 100.0% | 100.0% |
| Range | 5.4% | 3.6% |
| Mean | 98.6% | 98.9% |
| Median | 98.3% | 99.0% |
| Interquartile 25% (IQ1) | 97.7% | 98.0% |
| Interquartile 75% (IQ3) | 100.0% | 100.0% |
| Interquartile Range (IQR) | 2.3% | 2.0% |
| Standard Deviation (Sample) | 1.5% | 1.0% |
| Standard Deviation (Population) | 1.5% | 1.0% |
Demographics Similar to Immigrants from Italy and Immigrants from Romania by 3rd Grade
In terms of 3rd grade, the demographic groups most similar to Immigrants from Italy are Immigrants from Russia (97.8%, a difference of 0.0%), Immigrants from Eastern Europe (97.8%, a difference of 0.010%), Bermudan (97.8%, a difference of 0.010%), Immigrants from South Central Asia (97.8%, a difference of 0.030%), and Apache (97.8%, a difference of 0.030%). Similarly, the demographic groups most similar to Immigrants from Romania are Israeli (97.9%, a difference of 0.010%), Blackfeet (97.9%, a difference of 0.010%), Palestinian (97.9%, a difference of 0.020%), Immigrants from Turkey (97.9%, a difference of 0.030%), and Hmong (97.9%, a difference of 0.050%).
| Demographics | Rating | Rank | 3rd Grade |
| Immigrants | Romania | 87.9 /100 | #137 | Excellent 97.9% |
| Israelis | 86.6 /100 | #138 | Excellent 97.9% |
| Blackfeet | 86.3 /100 | #139 | Excellent 97.9% |
| Palestinians | 84.6 /100 | #140 | Excellent 97.9% |
| Immigrants | Turkey | 83.5 /100 | #141 | Excellent 97.9% |
| Hmong | 80.3 /100 | #142 | Excellent 97.9% |
| Filipinos | 79.9 /100 | #143 | Good 97.9% |
| Burmese | 79.6 /100 | #144 | Good 97.9% |
| Immigrants | Greece | 79.5 /100 | #145 | Good 97.9% |
| Alsatians | 78.3 /100 | #146 | Good 97.9% |
| Immigrants | Israel | 77.3 /100 | #147 | Good 97.9% |
| Immigrants | Moldova | 77.1 /100 | #148 | Good 97.9% |
| Immigrants | North Macedonia | 74.5 /100 | #149 | Good 97.8% |
| Jordanians | 74.5 /100 | #150 | Good 97.8% |
| Soviet Union | 72.6 /100 | #151 | Good 97.8% |
| Immigrants | South Central Asia | 69.5 /100 | #152 | Good 97.8% |
| Apache | 68.5 /100 | #153 | Good 97.8% |
| Immigrants | Eastern Europe | 64.1 /100 | #154 | Good 97.8% |
| Bermudans | 62.6 /100 | #155 | Good 97.8% |
| Immigrants | Russia | 61.7 /100 | #156 | Good 97.8% |
| Immigrants | Italy | 61.2 /100 | #157 | Good 97.8% |