Immigrants from Italy vs European 11th Grade
COMPARE
Immigrants from Italy
European
11th Grade
11th Grade Comparison
Immigrants from Italy
Europeans
92.9%
11TH GRADE
86.6/ 100
METRIC RATING
135th/ 347
METRIC RANK
94.4%
11TH GRADE
100.0/ 100
METRIC RATING
27th/ 347
METRIC RANK
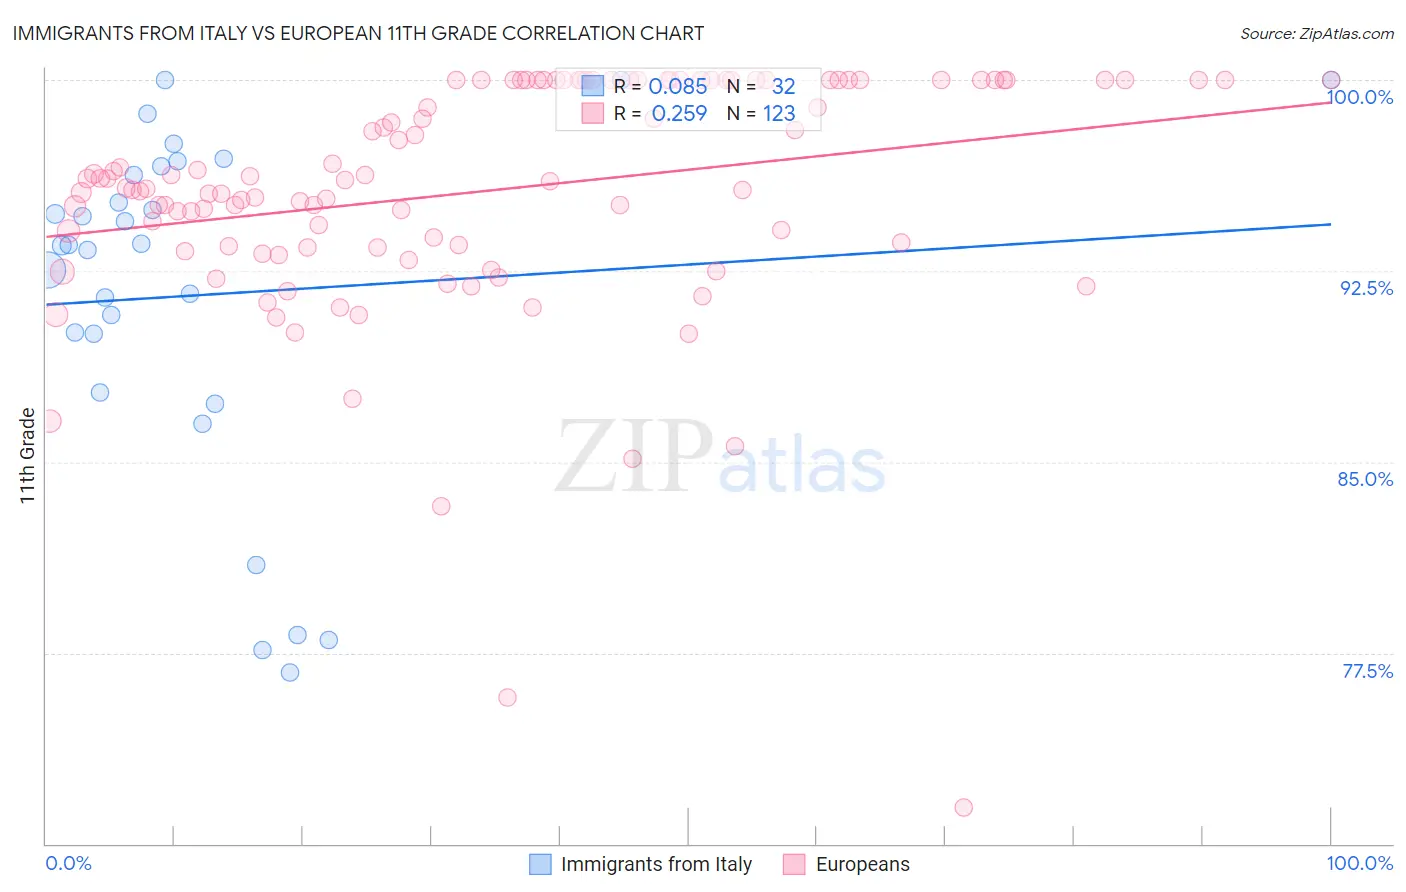
Immigrants from Italy vs European 11th Grade Correlation Chart
The statistical analysis conducted on geographies consisting of 324,226,009 people shows a slight positive correlation between the proportion of Immigrants from Italy and percentage of population with at least 11th grade education in the United States with a correlation coefficient (R) of 0.085 and weighted average of 92.9%. Similarly, the statistical analysis conducted on geographies consisting of 561,829,322 people shows a weak positive correlation between the proportion of Europeans and percentage of population with at least 11th grade education in the United States with a correlation coefficient (R) of 0.259 and weighted average of 94.4%, a difference of 1.5%.
11th Grade Correlation Summary
| Measurement | Immigrants from Italy | European |
| Minimum | 76.7% | 71.4% |
| Maximum | 100.0% | 100.0% |
| Range | 23.3% | 28.6% |
| Mean | 91.6% | 95.6% |
| Median | 93.5% | 96.0% |
| Interquartile 25% (IQ1) | 88.9% | 93.4% |
| Interquartile 75% (IQ3) | 96.5% | 100.0% |
| Interquartile Range (IQR) | 7.6% | 6.6% |
| Standard Deviation (Sample) | 6.8% | 4.7% |
| Standard Deviation (Population) | 6.7% | 4.7% |
Similar Demographics by 11th Grade
Demographics Similar to Immigrants from Italy by 11th Grade
In terms of 11th grade, the demographic groups most similar to Immigrants from Italy are Cree (92.9%, a difference of 0.010%), Mongolian (93.0%, a difference of 0.020%), Delaware (93.0%, a difference of 0.020%), Arab (92.9%, a difference of 0.020%), and Immigrants from Brazil (92.9%, a difference of 0.030%).
| Demographics | Rating | Rank | 11th Grade |
| Immigrants | Jordan | 92.4 /100 | #128 | Exceptional 93.1% |
| Immigrants | Ukraine | 89.8 /100 | #129 | Excellent 93.0% |
| Albanians | 89.5 /100 | #130 | Excellent 93.0% |
| Egyptians | 89.5 /100 | #131 | Excellent 93.0% |
| Immigrants | Bosnia and Herzegovina | 89.0 /100 | #132 | Excellent 93.0% |
| Mongolians | 87.6 /100 | #133 | Excellent 93.0% |
| Delaware | 87.3 /100 | #134 | Excellent 93.0% |
| Immigrants | Italy | 86.6 /100 | #135 | Excellent 92.9% |
| Cree | 85.9 /100 | #136 | Excellent 92.9% |
| Arabs | 85.4 /100 | #137 | Excellent 92.9% |
| Immigrants | Brazil | 85.1 /100 | #138 | Excellent 92.9% |
| Crow | 84.1 /100 | #139 | Excellent 92.9% |
| Venezuelans | 83.4 /100 | #140 | Excellent 92.9% |
| Chileans | 83.0 /100 | #141 | Excellent 92.9% |
| Kenyans | 82.0 /100 | #142 | Excellent 92.9% |
Demographics Similar to Europeans by 11th Grade
In terms of 11th grade, the demographic groups most similar to Europeans are Estonian (94.4%, a difference of 0.010%), Irish (94.4%, a difference of 0.020%), Scottish (94.4%, a difference of 0.020%), Dutch (94.3%, a difference of 0.030%), and English (94.4%, a difference of 0.040%).
| Demographics | Rating | Rank | 11th Grade |
| Italians | 100.0 /100 | #20 | Exceptional 94.5% |
| Tlingit-Haida | 100.0 /100 | #21 | Exceptional 94.4% |
| Tsimshian | 100.0 /100 | #22 | Exceptional 94.4% |
| Czechs | 100.0 /100 | #23 | Exceptional 94.4% |
| English | 100.0 /100 | #24 | Exceptional 94.4% |
| Irish | 100.0 /100 | #25 | Exceptional 94.4% |
| Scottish | 100.0 /100 | #26 | Exceptional 94.4% |
| Europeans | 100.0 /100 | #27 | Exceptional 94.4% |
| Estonians | 100.0 /100 | #28 | Exceptional 94.4% |
| Dutch | 100.0 /100 | #29 | Exceptional 94.3% |
| Russians | 100.0 /100 | #30 | Exceptional 94.3% |
| Welsh | 99.9 /100 | #31 | Exceptional 94.2% |
| Belgians | 99.9 /100 | #32 | Exceptional 94.2% |
| British | 99.9 /100 | #33 | Exceptional 94.2% |
| Immigrants | Scotland | 99.9 /100 | #34 | Exceptional 94.2% |