Immigrants from Italy vs Canadian 6th Grade
COMPARE
Immigrants from Italy
Canadian
6th Grade
6th Grade Comparison
Immigrants from Italy
Canadians
97.1%
6TH GRADE
53.8/ 100
METRIC RATING
166th/ 347
METRIC RANK
97.7%
6TH GRADE
99.7/ 100
METRIC RATING
64th/ 347
METRIC RANK
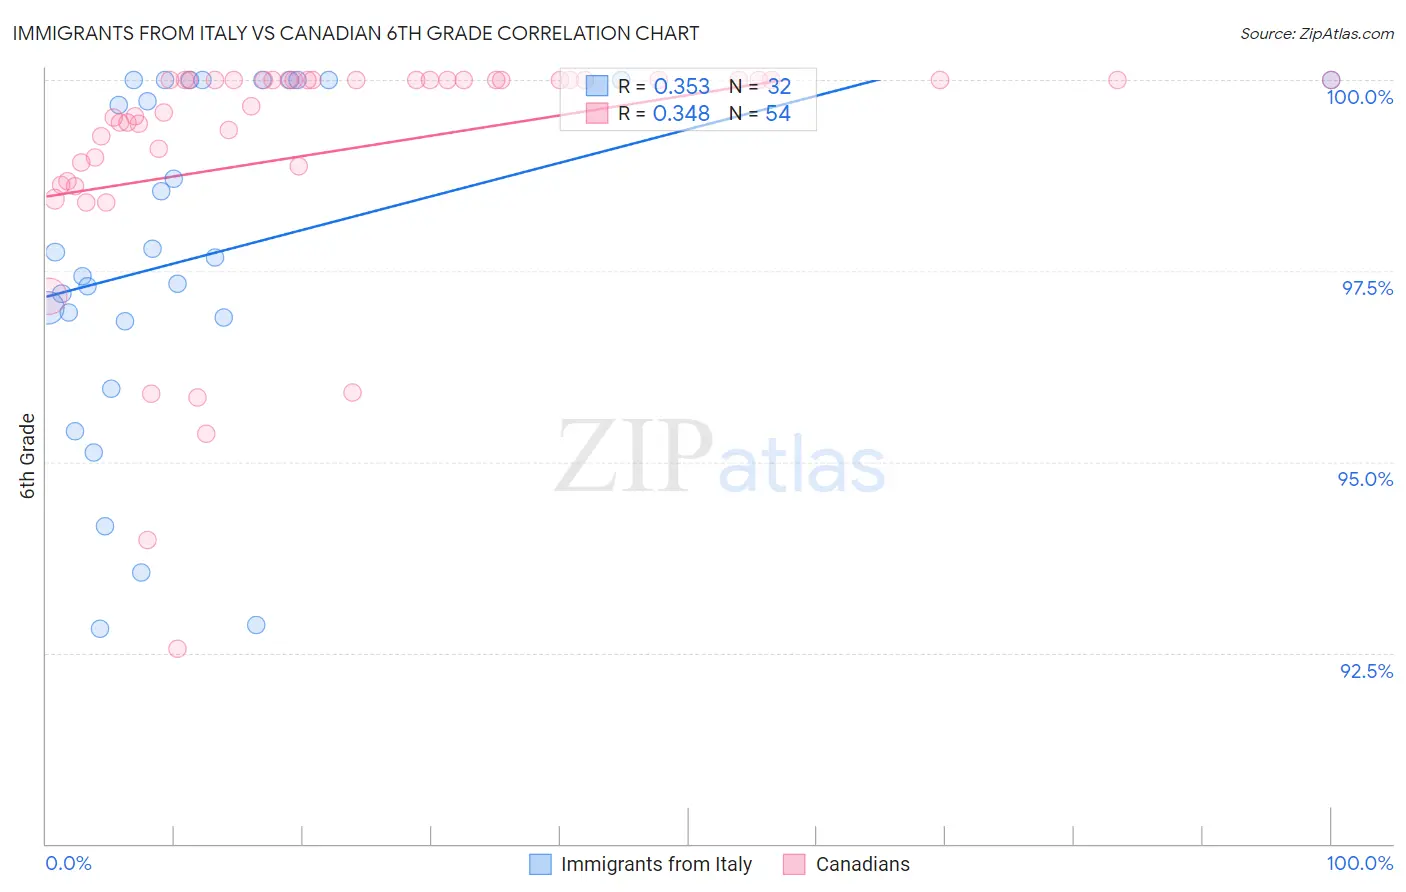
Immigrants from Italy vs Canadian 6th Grade Correlation Chart
The statistical analysis conducted on geographies consisting of 324,226,009 people shows a mild positive correlation between the proportion of Immigrants from Italy and percentage of population with at least 6th grade education in the United States with a correlation coefficient (R) of 0.353 and weighted average of 97.1%. Similarly, the statistical analysis conducted on geographies consisting of 437,556,929 people shows a mild positive correlation between the proportion of Canadians and percentage of population with at least 6th grade education in the United States with a correlation coefficient (R) of 0.348 and weighted average of 97.7%, a difference of 0.64%.
6th Grade Correlation Summary
| Measurement | Immigrants from Italy | Canadian |
| Minimum | 92.8% | 92.6% |
| Maximum | 100.0% | 100.0% |
| Range | 7.2% | 7.4% |
| Mean | 97.7% | 99.1% |
| Median | 97.7% | 100.0% |
| Interquartile 25% (IQ1) | 96.9% | 98.9% |
| Interquartile 75% (IQ3) | 100.0% | 100.0% |
| Interquartile Range (IQR) | 3.1% | 1.1% |
| Standard Deviation (Sample) | 2.3% | 1.6% |
| Standard Deviation (Population) | 2.2% | 1.6% |
Similar Demographics by 6th Grade
Demographics Similar to Immigrants from Italy by 6th Grade
In terms of 6th grade, the demographic groups most similar to Immigrants from Italy are Apache (97.1%, a difference of 0.0%), Immigrants from Taiwan (97.1%, a difference of 0.0%), Immigrants from Poland (97.1%, a difference of 0.010%), Bermudan (97.1%, a difference of 0.010%), and Chilean (97.1%, a difference of 0.010%).
| Demographics | Rating | Rank | 6th Grade |
| Kenyans | 62.9 /100 | #159 | Good 97.1% |
| Ugandans | 62.2 /100 | #160 | Good 97.1% |
| Immigrants | Belarus | 60.4 /100 | #161 | Good 97.1% |
| Marshallese | 60.2 /100 | #162 | Good 97.1% |
| Albanians | 57.8 /100 | #163 | Average 97.1% |
| Immigrants | Korea | 57.7 /100 | #164 | Average 97.1% |
| Immigrants | Poland | 56.2 /100 | #165 | Average 97.1% |
| Immigrants | Italy | 53.8 /100 | #166 | Average 97.1% |
| Apache | 53.6 /100 | #167 | Average 97.1% |
| Immigrants | Taiwan | 53.5 /100 | #168 | Average 97.1% |
| Bermudans | 52.6 /100 | #169 | Average 97.1% |
| Chileans | 52.1 /100 | #170 | Average 97.1% |
| Immigrants | Sri Lanka | 51.7 /100 | #171 | Average 97.1% |
| Egyptians | 50.9 /100 | #172 | Average 97.1% |
| Arabs | 50.1 /100 | #173 | Average 97.0% |
Demographics Similar to Canadians by 6th Grade
In terms of 6th grade, the demographic groups most similar to Canadians are Russian (97.7%, a difference of 0.010%), Immigrants from Northern Europe (97.7%, a difference of 0.010%), New Zealander (97.7%, a difference of 0.010%), Immigrants from North America (97.7%, a difference of 0.020%), and Kiowa (97.7%, a difference of 0.020%).
| Demographics | Rating | Rank | 6th Grade |
| Whites/Caucasians | 99.8 /100 | #57 | Exceptional 97.7% |
| Greeks | 99.8 /100 | #58 | Exceptional 97.7% |
| Americans | 99.8 /100 | #59 | Exceptional 97.7% |
| Immigrants | Canada | 99.8 /100 | #60 | Exceptional 97.7% |
| Serbians | 99.7 /100 | #61 | Exceptional 97.7% |
| Immigrants | North America | 99.7 /100 | #62 | Exceptional 97.7% |
| Russians | 99.7 /100 | #63 | Exceptional 97.7% |
| Canadians | 99.7 /100 | #64 | Exceptional 97.7% |
| Immigrants | Northern Europe | 99.6 /100 | #65 | Exceptional 97.7% |
| New Zealanders | 99.6 /100 | #66 | Exceptional 97.7% |
| Kiowa | 99.6 /100 | #67 | Exceptional 97.7% |
| Immigrants | Austria | 99.6 /100 | #68 | Exceptional 97.7% |
| Iranians | 99.6 /100 | #69 | Exceptional 97.6% |
| Cajuns | 99.5 /100 | #70 | Exceptional 97.6% |
| Chickasaw | 99.5 /100 | #71 | Exceptional 97.6% |