Immigrants from Italy vs Burmese Associate's Degree
COMPARE
Immigrants from Italy
Burmese
Associate's Degree
Associate's Degree Comparison
Immigrants from Italy
Burmese
49.3%
ASSOCIATE'S DEGREE
96.7/ 100
METRIC RATING
106th/ 347
METRIC RANK
54.6%
ASSOCIATE'S DEGREE
100.0/ 100
METRIC RATING
23rd/ 347
METRIC RANK
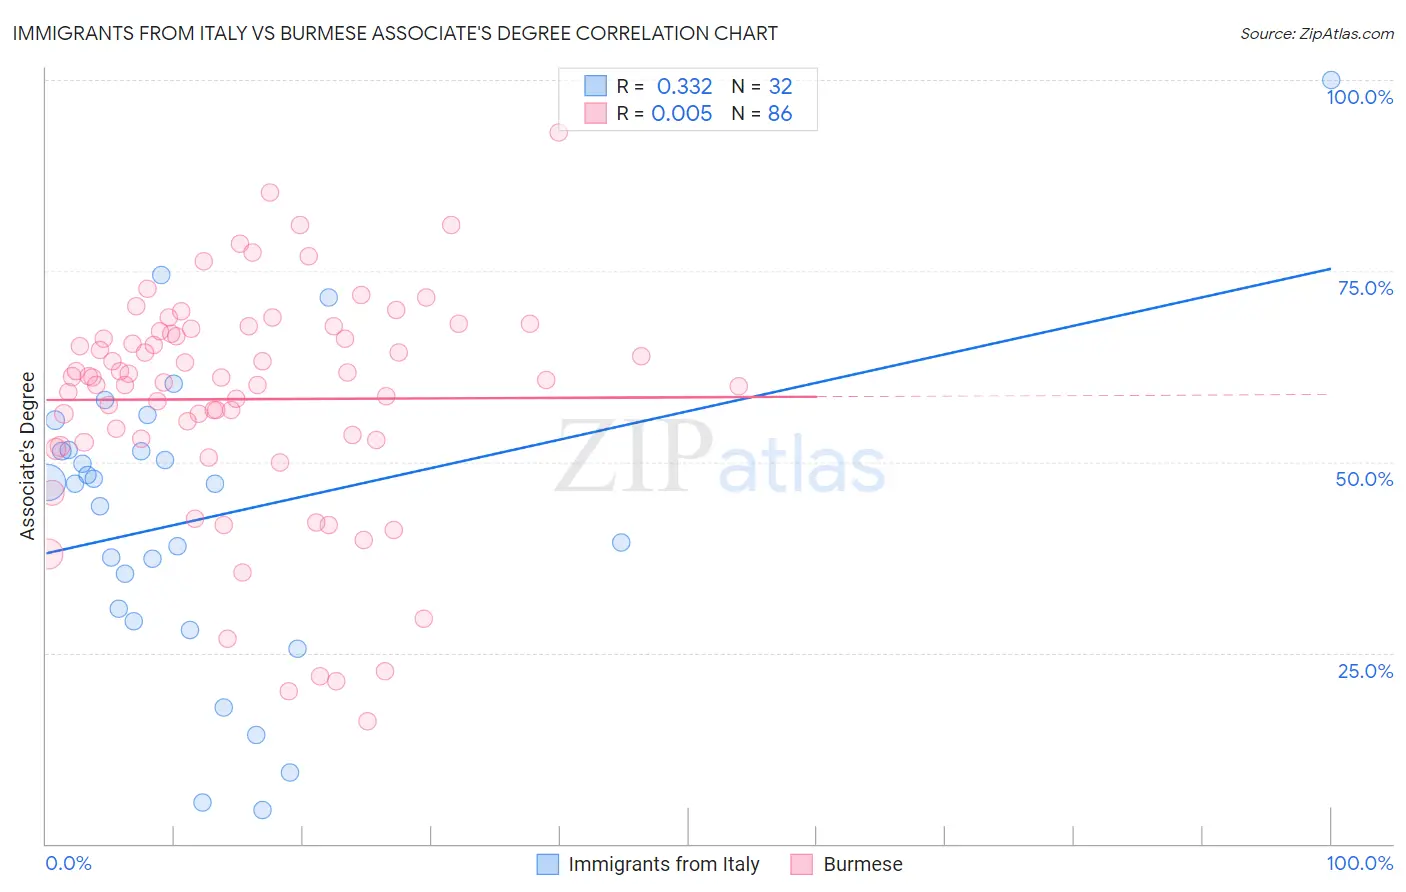
Immigrants from Italy vs Burmese Associate's Degree Correlation Chart
The statistical analysis conducted on geographies consisting of 324,223,165 people shows a mild positive correlation between the proportion of Immigrants from Italy and percentage of population with at least associate's degree education in the United States with a correlation coefficient (R) of 0.332 and weighted average of 49.3%. Similarly, the statistical analysis conducted on geographies consisting of 465,354,264 people shows no correlation between the proportion of Burmese and percentage of population with at least associate's degree education in the United States with a correlation coefficient (R) of 0.005 and weighted average of 54.6%, a difference of 10.7%.
Associate's Degree Correlation Summary
| Measurement | Immigrants from Italy | Burmese |
| Minimum | 4.5% | 16.1% |
| Maximum | 100.0% | 93.1% |
| Range | 95.5% | 77.0% |
| Mean | 42.7% | 58.2% |
| Median | 47.1% | 61.0% |
| Interquartile 25% (IQ1) | 30.0% | 52.9% |
| Interquartile 75% (IQ3) | 51.5% | 67.1% |
| Interquartile Range (IQR) | 21.5% | 14.2% |
| Standard Deviation (Sample) | 20.4% | 15.0% |
| Standard Deviation (Population) | 20.0% | 14.9% |
Similar Demographics by Associate's Degree
Demographics Similar to Immigrants from Italy by Associate's Degree
In terms of associate's degree, the demographic groups most similar to Immigrants from Italy are Croatian (49.3%, a difference of 0.0%), Syrian (49.3%, a difference of 0.030%), Jordanian (49.2%, a difference of 0.090%), Venezuelan (49.4%, a difference of 0.15%), and Ukrainian (49.4%, a difference of 0.21%).
| Demographics | Rating | Rank | Associate's Degree |
| Macedonians | 97.8 /100 | #99 | Exceptional 49.6% |
| Immigrants | Nepal | 97.5 /100 | #100 | Exceptional 49.5% |
| Northern Europeans | 97.3 /100 | #101 | Exceptional 49.5% |
| Chileans | 97.3 /100 | #102 | Exceptional 49.4% |
| Ukrainians | 97.1 /100 | #103 | Exceptional 49.4% |
| Venezuelans | 97.0 /100 | #104 | Exceptional 49.4% |
| Croatians | 96.8 /100 | #105 | Exceptional 49.3% |
| Immigrants | Italy | 96.7 /100 | #106 | Exceptional 49.3% |
| Syrians | 96.7 /100 | #107 | Exceptional 49.3% |
| Jordanians | 96.6 /100 | #108 | Exceptional 49.2% |
| Immigrants | Morocco | 96.3 /100 | #109 | Exceptional 49.2% |
| Austrians | 95.8 /100 | #110 | Exceptional 49.1% |
| Immigrants | Venezuela | 95.8 /100 | #111 | Exceptional 49.1% |
| Immigrants | Chile | 95.3 /100 | #112 | Exceptional 49.0% |
| Palestinians | 95.3 /100 | #113 | Exceptional 49.0% |
Demographics Similar to Burmese by Associate's Degree
In terms of associate's degree, the demographic groups most similar to Burmese are Immigrants from Japan (54.6%, a difference of 0.0%), Immigrants from Sweden (54.6%, a difference of 0.030%), Immigrants from Korea (54.5%, a difference of 0.090%), Cambodian (54.6%, a difference of 0.10%), and Immigrants from Ireland (54.7%, a difference of 0.12%).
| Demographics | Rating | Rank | Associate's Degree |
| Soviet Union | 100.0 /100 | #16 | Exceptional 55.1% |
| Eastern Europeans | 100.0 /100 | #17 | Exceptional 55.0% |
| Indians (Asian) | 100.0 /100 | #18 | Exceptional 54.8% |
| Immigrants | Ireland | 100.0 /100 | #19 | Exceptional 54.7% |
| Cambodians | 100.0 /100 | #20 | Exceptional 54.6% |
| Immigrants | Sweden | 100.0 /100 | #21 | Exceptional 54.6% |
| Immigrants | Japan | 100.0 /100 | #22 | Exceptional 54.6% |
| Burmese | 100.0 /100 | #23 | Exceptional 54.6% |
| Immigrants | Korea | 100.0 /100 | #24 | Exceptional 54.5% |
| Immigrants | Switzerland | 100.0 /100 | #25 | Exceptional 54.5% |
| Immigrants | Belgium | 100.0 /100 | #26 | Exceptional 54.5% |
| Latvians | 100.0 /100 | #27 | Exceptional 53.9% |
| Turks | 100.0 /100 | #28 | Exceptional 53.9% |
| Immigrants | France | 100.0 /100 | #29 | Exceptional 53.9% |
| Immigrants | Sri Lanka | 100.0 /100 | #30 | Exceptional 53.7% |