Immigrants from Ireland vs Immigrants from Lebanon Bachelor's Degree
COMPARE
Immigrants from Ireland
Immigrants from Lebanon
Bachelor's Degree
Bachelor's Degree Comparison
Immigrants from Ireland
Immigrants from Lebanon
47.1%
BACHELOR'S DEGREE
100.0/ 100
METRIC RATING
21st/ 347
METRIC RANK
42.4%
BACHELOR'S DEGREE
99.3/ 100
METRIC RATING
79th/ 347
METRIC RANK
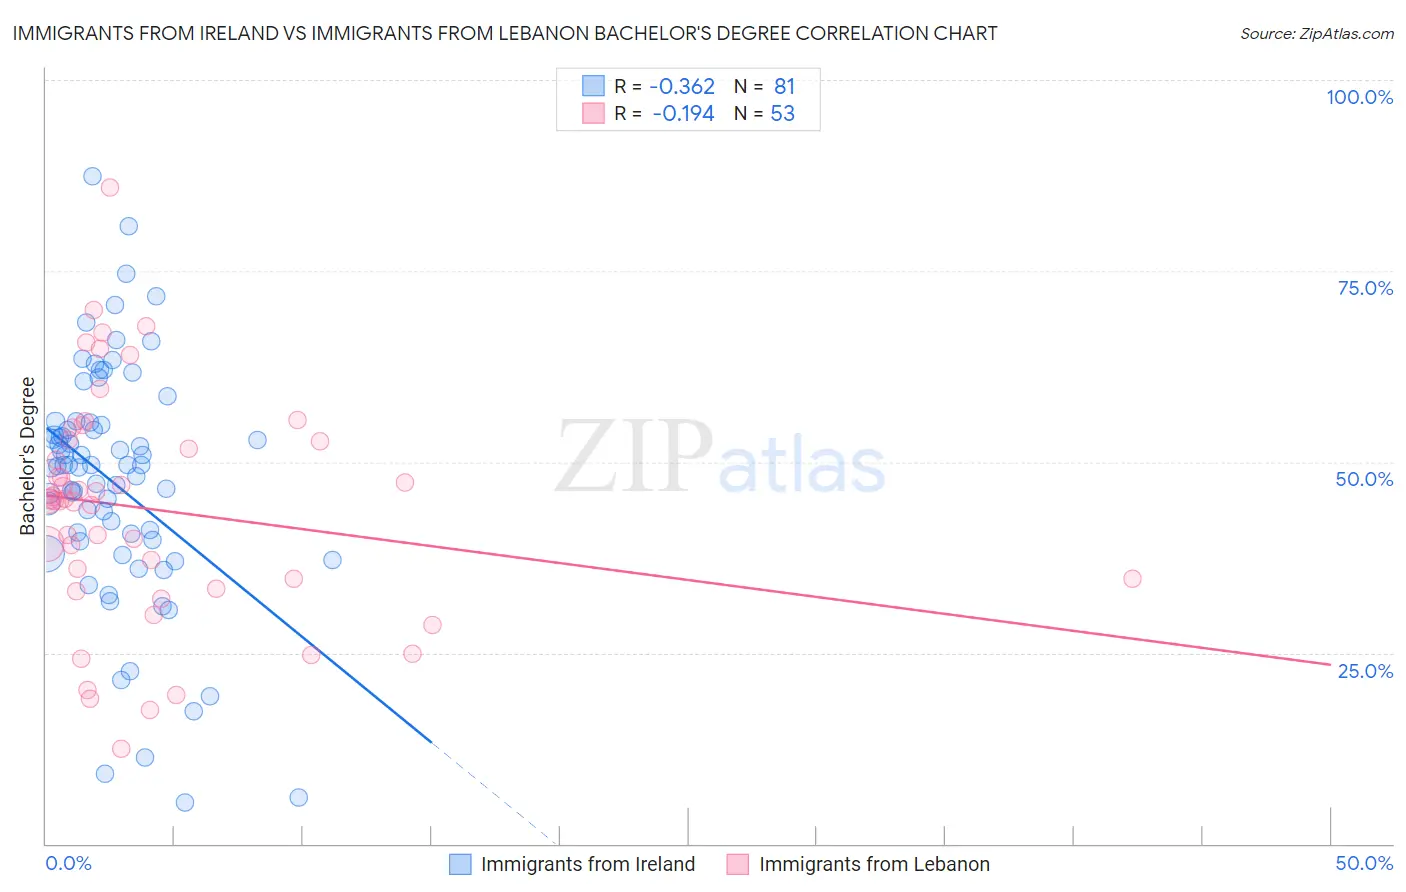
Immigrants from Ireland vs Immigrants from Lebanon Bachelor's Degree Correlation Chart
The statistical analysis conducted on geographies consisting of 240,784,048 people shows a mild negative correlation between the proportion of Immigrants from Ireland and percentage of population with at least bachelor's degree education in the United States with a correlation coefficient (R) of -0.362 and weighted average of 47.1%. Similarly, the statistical analysis conducted on geographies consisting of 217,160,107 people shows a poor negative correlation between the proportion of Immigrants from Lebanon and percentage of population with at least bachelor's degree education in the United States with a correlation coefficient (R) of -0.194 and weighted average of 42.4%, a difference of 11.2%.
Bachelor's Degree Correlation Summary
| Measurement | Immigrants from Ireland | Immigrants from Lebanon |
| Minimum | 5.4% | 12.4% |
| Maximum | 87.3% | 86.0% |
| Range | 82.0% | 73.5% |
| Mean | 47.3% | 43.8% |
| Median | 49.6% | 45.0% |
| Interquartile 25% (IQ1) | 39.7% | 34.0% |
| Interquartile 75% (IQ3) | 54.9% | 52.8% |
| Interquartile Range (IQR) | 15.2% | 18.8% |
| Standard Deviation (Sample) | 15.7% | 15.0% |
| Standard Deviation (Population) | 15.6% | 14.8% |
Similar Demographics by Bachelor's Degree
Demographics Similar to Immigrants from Ireland by Bachelor's Degree
In terms of bachelor's degree, the demographic groups most similar to Immigrants from Ireland are Immigrants from Switzerland (47.1%, a difference of 0.010%), Immigrants from Belgium (47.0%, a difference of 0.20%), Cambodian (47.2%, a difference of 0.23%), Immigrants from Sweden (47.0%, a difference of 0.29%), and Immigrants from Korea (47.0%, a difference of 0.33%).
| Demographics | Rating | Rank | Bachelor's Degree |
| Immigrants | Hong Kong | 100.0 /100 | #14 | Exceptional 48.2% |
| Immigrants | Eastern Asia | 100.0 /100 | #15 | Exceptional 48.1% |
| Soviet Union | 100.0 /100 | #16 | Exceptional 47.9% |
| Eastern Europeans | 100.0 /100 | #17 | Exceptional 47.5% |
| Indians (Asian) | 100.0 /100 | #18 | Exceptional 47.4% |
| Cambodians | 100.0 /100 | #19 | Exceptional 47.2% |
| Immigrants | Switzerland | 100.0 /100 | #20 | Exceptional 47.1% |
| Immigrants | Ireland | 100.0 /100 | #21 | Exceptional 47.1% |
| Immigrants | Belgium | 100.0 /100 | #22 | Exceptional 47.0% |
| Immigrants | Sweden | 100.0 /100 | #23 | Exceptional 47.0% |
| Immigrants | Korea | 100.0 /100 | #24 | Exceptional 47.0% |
| Burmese | 100.0 /100 | #25 | Exceptional 46.9% |
| Immigrants | Japan | 100.0 /100 | #26 | Exceptional 46.8% |
| Immigrants | France | 100.0 /100 | #27 | Exceptional 46.4% |
| Turks | 100.0 /100 | #28 | Exceptional 46.2% |
Demographics Similar to Immigrants from Lebanon by Bachelor's Degree
In terms of bachelor's degree, the demographic groups most similar to Immigrants from Lebanon are Immigrants from Ethiopia (42.5%, a difference of 0.17%), Immigrants from Croatia (42.3%, a difference of 0.20%), Immigrants from Hungary (42.3%, a difference of 0.21%), Immigrants from Eastern Europe (42.5%, a difference of 0.23%), and Immigrants from Scotland (42.3%, a difference of 0.28%).
| Demographics | Rating | Rank | Bachelor's Degree |
| Ethiopians | 99.5 /100 | #72 | Exceptional 42.8% |
| Immigrants | Uzbekistan | 99.5 /100 | #73 | Exceptional 42.8% |
| Bhutanese | 99.5 /100 | #74 | Exceptional 42.7% |
| Immigrants | Zimbabwe | 99.4 /100 | #75 | Exceptional 42.6% |
| Immigrants | Egypt | 99.4 /100 | #76 | Exceptional 42.6% |
| Immigrants | Eastern Europe | 99.4 /100 | #77 | Exceptional 42.5% |
| Immigrants | Ethiopia | 99.4 /100 | #78 | Exceptional 42.5% |
| Immigrants | Lebanon | 99.3 /100 | #79 | Exceptional 42.4% |
| Immigrants | Croatia | 99.2 /100 | #80 | Exceptional 42.3% |
| Immigrants | Hungary | 99.2 /100 | #81 | Exceptional 42.3% |
| Immigrants | Scotland | 99.2 /100 | #82 | Exceptional 42.3% |
| Armenians | 99.2 /100 | #83 | Exceptional 42.3% |
| Immigrants | Western Asia | 99.2 /100 | #84 | Exceptional 42.3% |
| Lithuanians | 99.2 /100 | #85 | Exceptional 42.2% |
| Immigrants | Brazil | 99.2 /100 | #86 | Exceptional 42.2% |