Immigrants from Ireland vs Bangladeshi 7th Grade
COMPARE
Immigrants from Ireland
Bangladeshi
7th Grade
7th Grade Comparison
Immigrants from Ireland
Bangladeshis
96.8%
7TH GRADE
99.4/ 100
METRIC RATING
76th/ 347
METRIC RANK
94.5%
7TH GRADE
0.0/ 100
METRIC RATING
299th/ 347
METRIC RANK
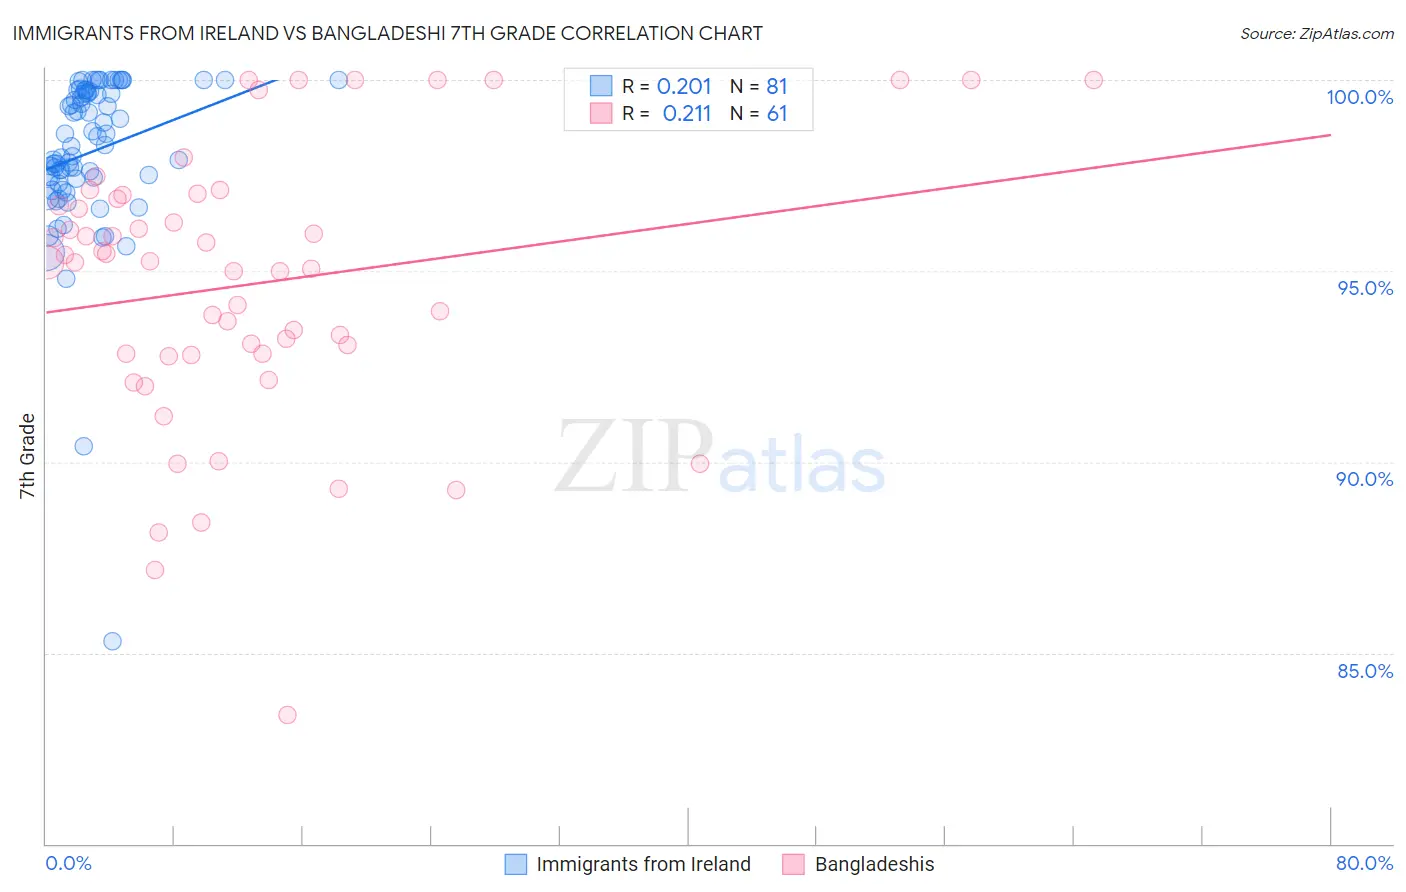
Immigrants from Ireland vs Bangladeshi 7th Grade Correlation Chart
The statistical analysis conducted on geographies consisting of 240,784,498 people shows a weak positive correlation between the proportion of Immigrants from Ireland and percentage of population with at least 7th grade education in the United States with a correlation coefficient (R) of 0.201 and weighted average of 96.8%. Similarly, the statistical analysis conducted on geographies consisting of 141,430,495 people shows a weak positive correlation between the proportion of Bangladeshis and percentage of population with at least 7th grade education in the United States with a correlation coefficient (R) of 0.211 and weighted average of 94.5%, a difference of 2.4%.
7th Grade Correlation Summary
| Measurement | Immigrants from Ireland | Bangladeshi |
| Minimum | 85.3% | 83.4% |
| Maximum | 100.0% | 100.0% |
| Range | 14.7% | 16.6% |
| Mean | 98.1% | 94.7% |
| Median | 98.3% | 95.2% |
| Interquartile 25% (IQ1) | 97.4% | 92.8% |
| Interquartile 75% (IQ3) | 99.7% | 96.9% |
| Interquartile Range (IQR) | 2.3% | 4.1% |
| Standard Deviation (Sample) | 2.2% | 3.6% |
| Standard Deviation (Population) | 2.2% | 3.6% |
Similar Demographics by 7th Grade
Demographics Similar to Immigrants from Ireland by 7th Grade
In terms of 7th grade, the demographic groups most similar to Immigrants from Ireland are Cherokee (96.8%, a difference of 0.0%), Immigrants from Netherlands (96.8%, a difference of 0.010%), Cypriot (96.8%, a difference of 0.010%), Yugoslavian (96.8%, a difference of 0.010%), and Zimbabwean (96.8%, a difference of 0.020%).
| Demographics | Rating | Rank | 7th Grade |
| Iranians | 99.6 /100 | #69 | Exceptional 96.8% |
| New Zealanders | 99.6 /100 | #70 | Exceptional 96.8% |
| Immigrants | Lithuania | 99.6 /100 | #71 | Exceptional 96.8% |
| Cajuns | 99.5 /100 | #72 | Exceptional 96.8% |
| Arapaho | 99.5 /100 | #73 | Exceptional 96.8% |
| Immigrants | England | 99.5 /100 | #74 | Exceptional 96.8% |
| Zimbabweans | 99.5 /100 | #75 | Exceptional 96.8% |
| Immigrants | Ireland | 99.4 /100 | #76 | Exceptional 96.8% |
| Cherokee | 99.4 /100 | #77 | Exceptional 96.8% |
| Immigrants | Netherlands | 99.3 /100 | #78 | Exceptional 96.8% |
| Cypriots | 99.3 /100 | #79 | Exceptional 96.8% |
| Yugoslavians | 99.3 /100 | #80 | Exceptional 96.8% |
| Delaware | 99.2 /100 | #81 | Exceptional 96.8% |
| Chickasaw | 99.2 /100 | #82 | Exceptional 96.7% |
| Icelanders | 99.1 /100 | #83 | Exceptional 96.7% |
Demographics Similar to Bangladeshis by 7th Grade
In terms of 7th grade, the demographic groups most similar to Bangladeshis are Immigrants from South Eastern Asia (94.5%, a difference of 0.010%), Indonesian (94.5%, a difference of 0.010%), Immigrants from Burma/Myanmar (94.5%, a difference of 0.040%), Immigrants from Dominica (94.5%, a difference of 0.070%), and Immigrants from Laos (94.5%, a difference of 0.070%).
| Demographics | Rating | Rank | 7th Grade |
| Immigrants | West Indies | 0.0 /100 | #292 | Tragic 94.8% |
| Fijians | 0.0 /100 | #293 | Tragic 94.7% |
| Haitians | 0.0 /100 | #294 | Tragic 94.7% |
| Yaqui | 0.0 /100 | #295 | Tragic 94.6% |
| Cubans | 0.0 /100 | #296 | Tragic 94.6% |
| Immigrants | South Eastern Asia | 0.0 /100 | #297 | Tragic 94.5% |
| Indonesians | 0.0 /100 | #298 | Tragic 94.5% |
| Bangladeshis | 0.0 /100 | #299 | Tragic 94.5% |
| Immigrants | Burma/Myanmar | 0.0 /100 | #300 | Tragic 94.5% |
| Immigrants | Dominica | 0.0 /100 | #301 | Tragic 94.5% |
| Immigrants | Laos | 0.0 /100 | #302 | Tragic 94.5% |
| Sri Lankans | 0.0 /100 | #303 | Tragic 94.4% |
| Immigrants | Haiti | 0.0 /100 | #304 | Tragic 94.3% |
| Guyanese | 0.0 /100 | #305 | Tragic 94.3% |
| Immigrants | Guyana | 0.0 /100 | #306 | Tragic 94.2% |