Immigrants from Iran vs Sri Lankan Professional Degree
COMPARE
Immigrants from Iran
Sri Lankan
Professional Degree
Professional Degree Comparison
Immigrants from Iran
Sri Lankans
7.3%
PROFESSIONAL DEGREE
100.0/ 100
METRIC RATING
5th/ 347
METRIC RANK
4.3%
PROFESSIONAL DEGREE
29.0/ 100
METRIC RATING
191st/ 347
METRIC RANK
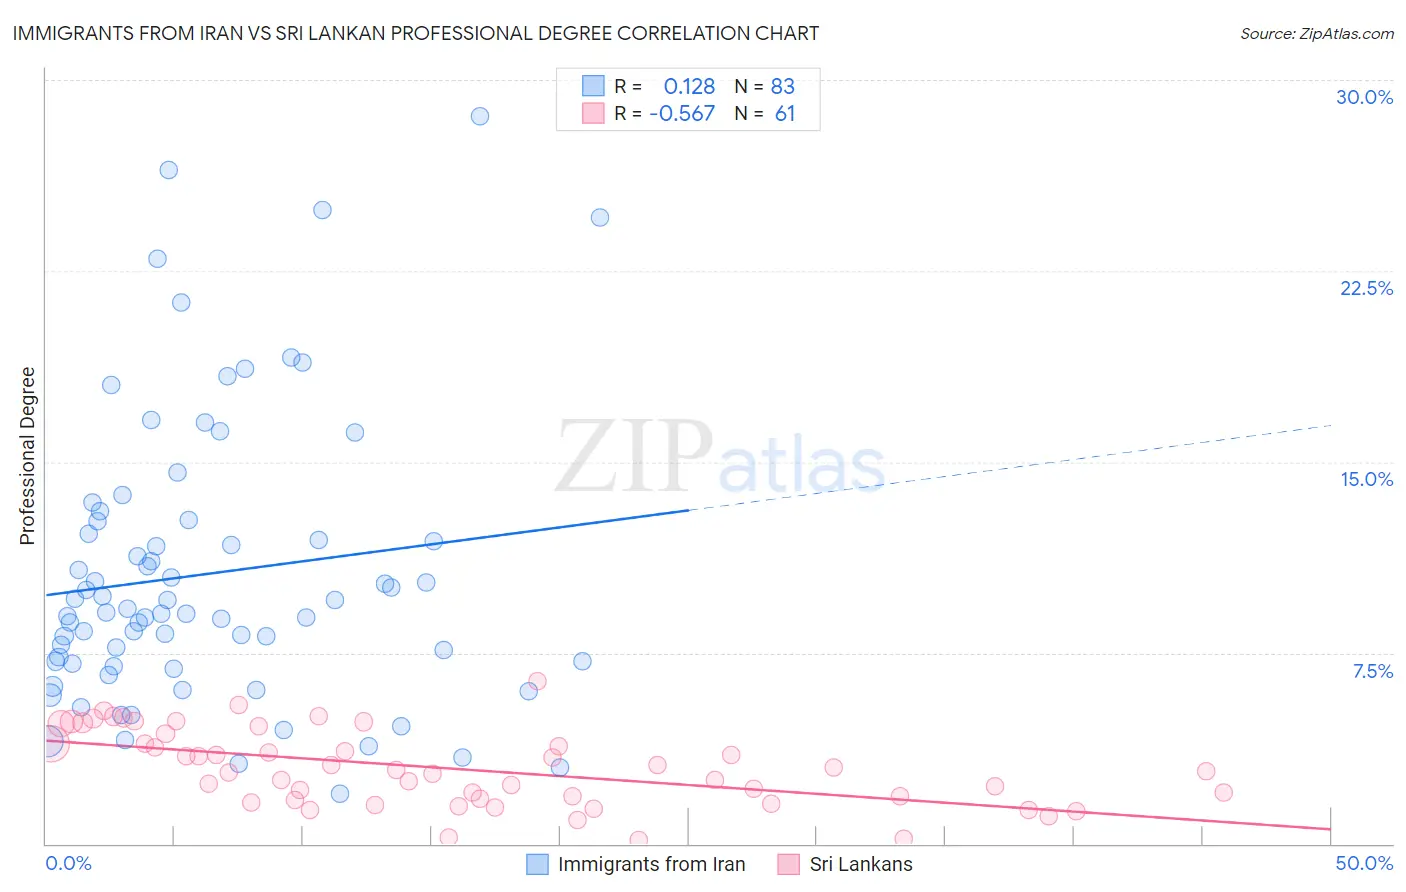
Immigrants from Iran vs Sri Lankan Professional Degree Correlation Chart
The statistical analysis conducted on geographies consisting of 279,790,021 people shows a poor positive correlation between the proportion of Immigrants from Iran and percentage of population with at least professional degree education in the United States with a correlation coefficient (R) of 0.128 and weighted average of 7.3%. Similarly, the statistical analysis conducted on geographies consisting of 439,314,043 people shows a substantial negative correlation between the proportion of Sri Lankans and percentage of population with at least professional degree education in the United States with a correlation coefficient (R) of -0.567 and weighted average of 4.3%, a difference of 71.8%.
Professional Degree Correlation Summary
| Measurement | Immigrants from Iran | Sri Lankan |
| Minimum | 1.9% | 0.14% |
| Maximum | 28.6% | 6.4% |
| Range | 26.6% | 6.2% |
| Mean | 10.6% | 3.0% |
| Median | 9.1% | 2.9% |
| Interquartile 25% (IQ1) | 7.1% | 1.8% |
| Interquartile 75% (IQ3) | 12.7% | 4.1% |
| Interquartile Range (IQR) | 5.6% | 2.4% |
| Standard Deviation (Sample) | 5.6% | 1.5% |
| Standard Deviation (Population) | 5.6% | 1.5% |
Similar Demographics by Professional Degree
Demographics Similar to Immigrants from Iran by Professional Degree
In terms of professional degree, the demographic groups most similar to Immigrants from Iran are Okinawan (7.3%, a difference of 0.11%), Filipino (7.6%, a difference of 3.2%), Eastern European (7.1%, a difference of 3.3%), Immigrants from Switzerland (7.1%, a difference of 3.4%), and Immigrants from Taiwan (7.1%, a difference of 3.6%).
| Demographics | Rating | Rank | Professional Degree |
| Immigrants | Israel | 100.0 /100 | #1 | Exceptional 7.9% |
| Immigrants | Singapore | 100.0 /100 | #2 | Exceptional 7.7% |
| Iranians | 100.0 /100 | #3 | Exceptional 7.6% |
| Filipinos | 100.0 /100 | #4 | Exceptional 7.6% |
| Immigrants | Iran | 100.0 /100 | #5 | Exceptional 7.3% |
| Okinawans | 100.0 /100 | #6 | Exceptional 7.3% |
| Eastern Europeans | 100.0 /100 | #7 | Exceptional 7.1% |
| Immigrants | Switzerland | 100.0 /100 | #8 | Exceptional 7.1% |
| Immigrants | Taiwan | 100.0 /100 | #9 | Exceptional 7.1% |
| Immigrants | Belgium | 100.0 /100 | #10 | Exceptional 7.0% |
| Cypriots | 100.0 /100 | #11 | Exceptional 6.9% |
| Israelis | 100.0 /100 | #12 | Exceptional 6.9% |
| Immigrants | Australia | 100.0 /100 | #13 | Exceptional 6.9% |
| Immigrants | France | 100.0 /100 | #14 | Exceptional 6.8% |
| Immigrants | China | 100.0 /100 | #15 | Exceptional 6.7% |
Demographics Similar to Sri Lankans by Professional Degree
In terms of professional degree, the demographic groups most similar to Sri Lankans are Immigrants from Poland (4.3%, a difference of 0.040%), Slovak (4.3%, a difference of 0.30%), Ghanaian (4.3%, a difference of 0.32%), French (4.2%, a difference of 0.37%), and Immigrants from Thailand (4.3%, a difference of 0.47%).
| Demographics | Rating | Rank | Professional Degree |
| Belgians | 36.2 /100 | #184 | Fair 4.3% |
| Welsh | 35.8 /100 | #185 | Fair 4.3% |
| Scotch-Irish | 34.2 /100 | #186 | Fair 4.3% |
| Immigrants | Cameroon | 33.3 /100 | #187 | Fair 4.3% |
| Immigrants | Thailand | 31.7 /100 | #188 | Fair 4.3% |
| Slovaks | 30.7 /100 | #189 | Fair 4.3% |
| Immigrants | Poland | 29.2 /100 | #190 | Fair 4.3% |
| Sri Lankans | 29.0 /100 | #191 | Fair 4.3% |
| Ghanaians | 27.3 /100 | #192 | Fair 4.3% |
| French | 27.1 /100 | #193 | Fair 4.2% |
| Scandinavians | 25.8 /100 | #194 | Fair 4.2% |
| Nigerians | 24.6 /100 | #195 | Fair 4.2% |
| Spanish | 23.0 /100 | #196 | Fair 4.2% |
| Czechoslovakians | 22.4 /100 | #197 | Fair 4.2% |
| Immigrants | Middle Africa | 22.1 /100 | #198 | Fair 4.2% |