Immigrants from India vs South American Indian 5th Grade
COMPARE
Immigrants from India
South American Indian
5th Grade
5th Grade Comparison
Immigrants from India
South American Indians
97.8%
5TH GRADE
99.2/ 100
METRIC RATING
80th/ 347
METRIC RANK
97.0%
5TH GRADE
5.4/ 100
METRIC RATING
224th/ 347
METRIC RANK
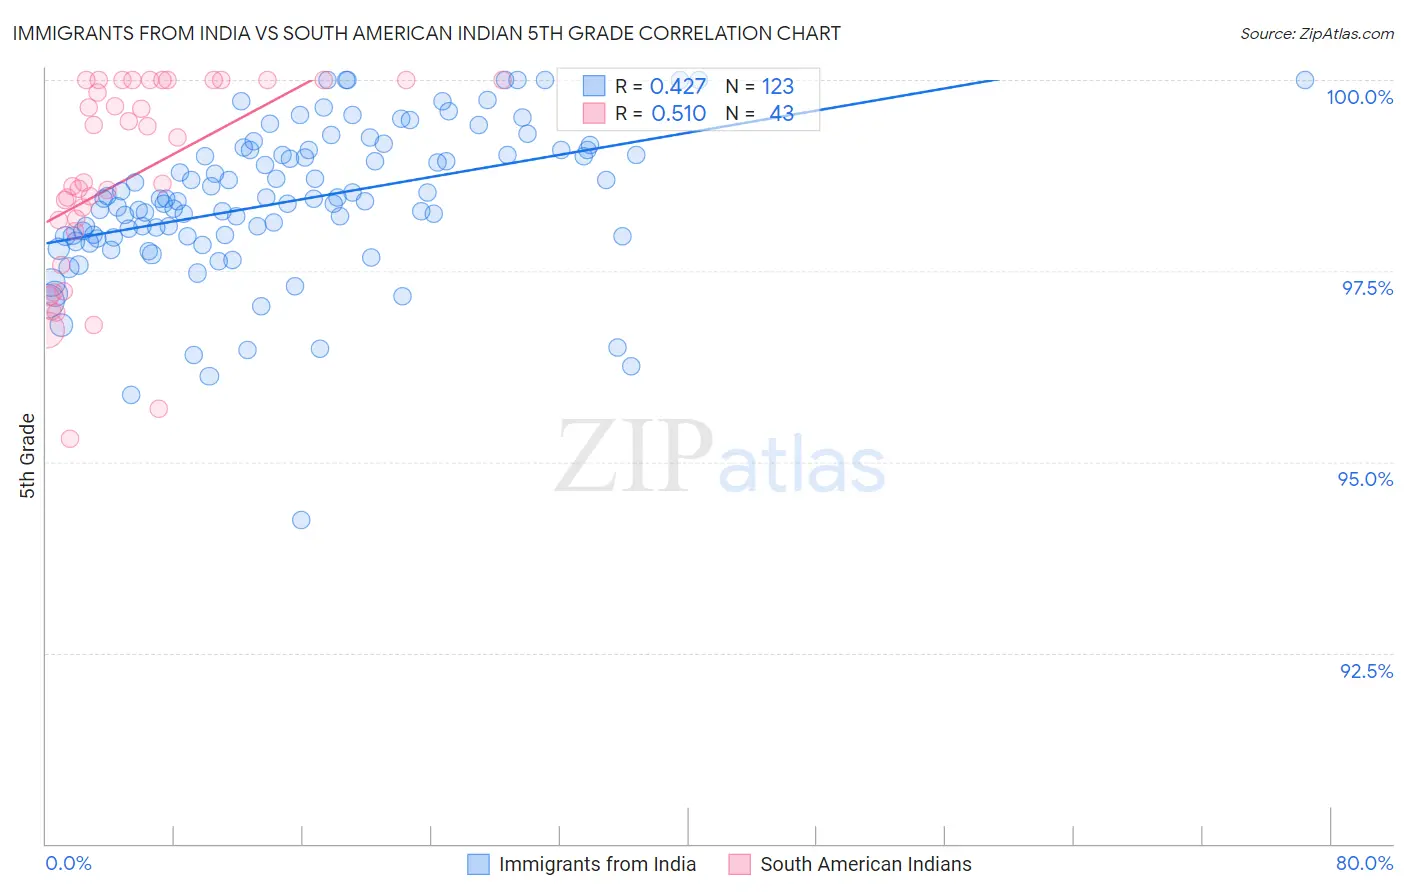
Immigrants from India vs South American Indian 5th Grade Correlation Chart
The statistical analysis conducted on geographies consisting of 434,105,844 people shows a moderate positive correlation between the proportion of Immigrants from India and percentage of population with at least 5th grade education in the United States with a correlation coefficient (R) of 0.427 and weighted average of 97.8%. Similarly, the statistical analysis conducted on geographies consisting of 164,573,401 people shows a substantial positive correlation between the proportion of South American Indians and percentage of population with at least 5th grade education in the United States with a correlation coefficient (R) of 0.510 and weighted average of 97.0%, a difference of 0.80%.
5th Grade Correlation Summary
| Measurement | Immigrants from India | South American Indian |
| Minimum | 94.2% | 95.3% |
| Maximum | 100.0% | 100.0% |
| Range | 5.8% | 4.7% |
| Mean | 98.4% | 98.7% |
| Median | 98.4% | 98.7% |
| Interquartile 25% (IQ1) | 97.9% | 98.0% |
| Interquartile 75% (IQ3) | 99.1% | 100.0% |
| Interquartile Range (IQR) | 1.1% | 2.0% |
| Standard Deviation (Sample) | 0.99% | 1.3% |
| Standard Deviation (Population) | 0.99% | 1.3% |
Similar Demographics by 5th Grade
Demographics Similar to Immigrants from India by 5th Grade
In terms of 5th grade, the demographic groups most similar to Immigrants from India are Immigrants from Lithuania (97.8%, a difference of 0.0%), Icelander (97.8%, a difference of 0.0%), Pueblo (97.8%, a difference of 0.0%), Immigrants from England (97.8%, a difference of 0.010%), and Osage (97.8%, a difference of 0.010%).
| Demographics | Rating | Rank | 5th Grade |
| Cherokee | 99.4 /100 | #73 | Exceptional 97.8% |
| Lumbee | 99.3 /100 | #74 | Exceptional 97.8% |
| Ukrainians | 99.3 /100 | #75 | Exceptional 97.8% |
| Immigrants | Netherlands | 99.3 /100 | #76 | Exceptional 97.8% |
| Immigrants | England | 99.3 /100 | #77 | Exceptional 97.8% |
| Osage | 99.3 /100 | #78 | Exceptional 97.8% |
| Immigrants | Lithuania | 99.2 /100 | #79 | Exceptional 97.8% |
| Immigrants | India | 99.2 /100 | #80 | Exceptional 97.8% |
| Icelanders | 99.2 /100 | #81 | Exceptional 97.8% |
| Pueblo | 99.2 /100 | #82 | Exceptional 97.8% |
| Zimbabweans | 99.0 /100 | #83 | Exceptional 97.8% |
| Potawatomi | 99.0 /100 | #84 | Exceptional 97.8% |
| Immigrants | Belgium | 99.0 /100 | #85 | Exceptional 97.8% |
| Cypriots | 98.9 /100 | #86 | Exceptional 97.8% |
| Immigrants | Australia | 98.8 /100 | #87 | Exceptional 97.8% |
Demographics Similar to South American Indians by 5th Grade
In terms of 5th grade, the demographic groups most similar to South American Indians are Liberian (97.0%, a difference of 0.0%), Bahamian (97.0%, a difference of 0.0%), Tongan (97.0%, a difference of 0.0%), Sierra Leonean (97.1%, a difference of 0.010%), and Immigrants from Panama (97.0%, a difference of 0.010%).
| Demographics | Rating | Rank | 5th Grade |
| Immigrants | Lebanon | 6.8 /100 | #217 | Tragic 97.1% |
| Immigrants | Sudan | 6.5 /100 | #218 | Tragic 97.1% |
| Immigrants | Syria | 6.4 /100 | #219 | Tragic 97.1% |
| Immigrants | Southern Europe | 6.3 /100 | #220 | Tragic 97.1% |
| Sierra Leoneans | 6.0 /100 | #221 | Tragic 97.1% |
| Immigrants | Panama | 5.7 /100 | #222 | Tragic 97.0% |
| Liberians | 5.7 /100 | #223 | Tragic 97.0% |
| South American Indians | 5.4 /100 | #224 | Tragic 97.0% |
| Bahamians | 5.3 /100 | #225 | Tragic 97.0% |
| Tongans | 5.3 /100 | #226 | Tragic 97.0% |
| Immigrants | Pakistan | 4.7 /100 | #227 | Tragic 97.0% |
| Assyrians/Chaldeans/Syriacs | 4.5 /100 | #228 | Tragic 97.0% |
| Yuman | 4.5 /100 | #229 | Tragic 97.0% |
| Immigrants | Western Asia | 4.3 /100 | #230 | Tragic 97.0% |
| Immigrants | Malaysia | 4.1 /100 | #231 | Tragic 97.0% |