Immigrants from India vs Guamanian/Chamorro 1st Grade
COMPARE
Immigrants from India
Guamanian/Chamorro
1st Grade
1st Grade Comparison
Immigrants from India
Guamanians/Chamorros
98.2%
1ST GRADE
98.6/ 100
METRIC RATING
93rd/ 347
METRIC RANK
97.8%
1ST GRADE
26.2/ 100
METRIC RATING
197th/ 347
METRIC RANK
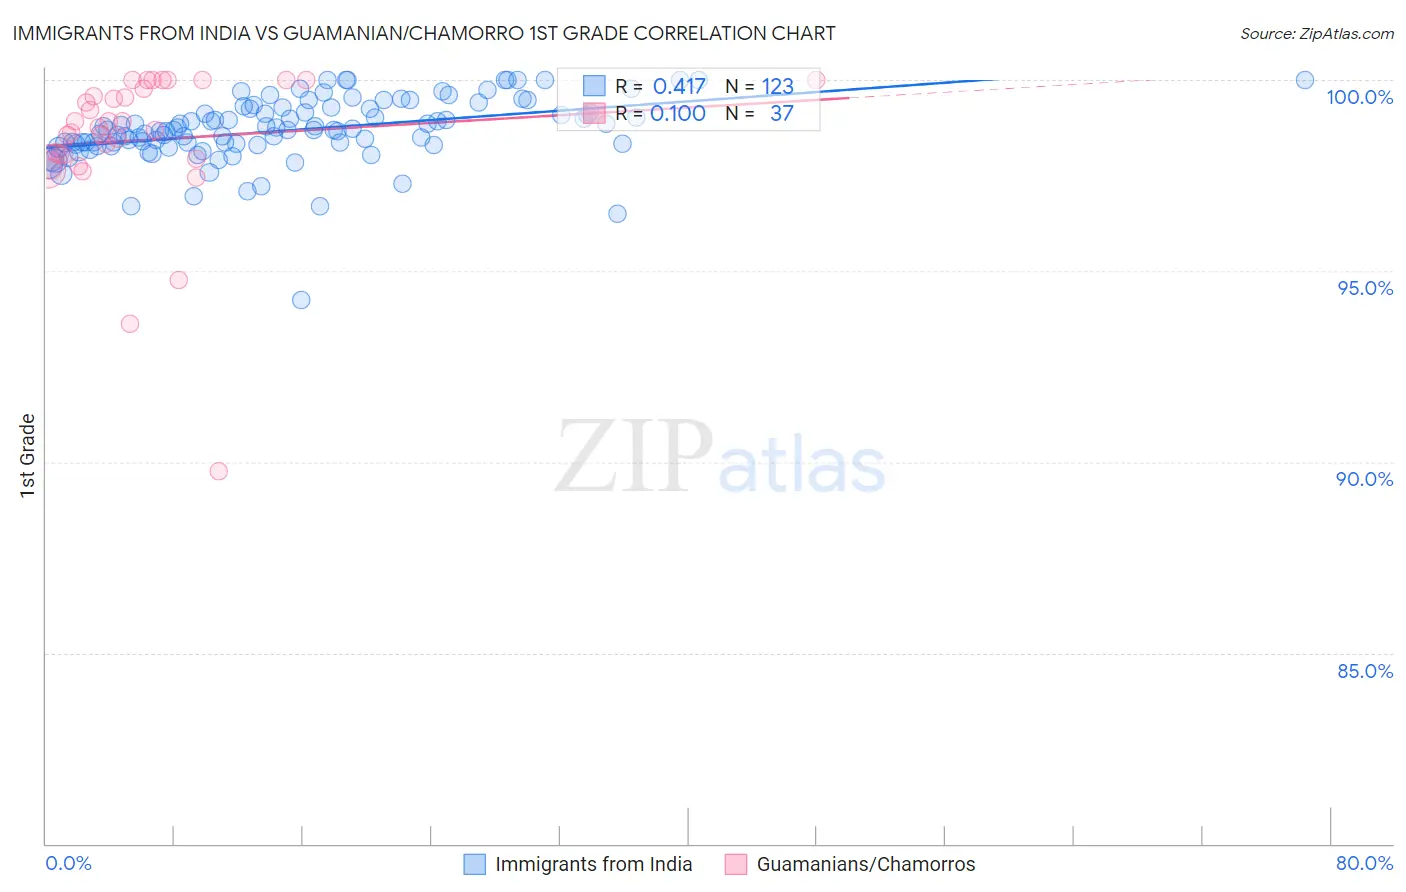
Immigrants from India vs Guamanian/Chamorro 1st Grade Correlation Chart
The statistical analysis conducted on geographies consisting of 434,105,844 people shows a moderate positive correlation between the proportion of Immigrants from India and percentage of population with at least 1st grade education in the United States with a correlation coefficient (R) of 0.417 and weighted average of 98.2%. Similarly, the statistical analysis conducted on geographies consisting of 221,965,618 people shows a slight positive correlation between the proportion of Guamanians/Chamorros and percentage of population with at least 1st grade education in the United States with a correlation coefficient (R) of 0.100 and weighted average of 97.8%, a difference of 0.41%.
1st Grade Correlation Summary
| Measurement | Immigrants from India | Guamanian/Chamorro |
| Minimum | 94.2% | 89.7% |
| Maximum | 100.0% | 100.0% |
| Range | 5.8% | 10.3% |
| Mean | 98.7% | 98.4% |
| Median | 98.7% | 98.8% |
| Interquartile 25% (IQ1) | 98.3% | 98.0% |
| Interquartile 75% (IQ3) | 99.2% | 99.9% |
| Interquartile Range (IQR) | 0.93% | 1.9% |
| Standard Deviation (Sample) | 0.85% | 2.0% |
| Standard Deviation (Population) | 0.85% | 2.0% |
Similar Demographics by 1st Grade
Demographics Similar to Immigrants from India by 1st Grade
In terms of 1st grade, the demographic groups most similar to Immigrants from India are South African (98.2%, a difference of 0.0%), Immigrants from Germany (98.2%, a difference of 0.0%), Immigrants from South Africa (98.3%, a difference of 0.010%), Ukrainian (98.3%, a difference of 0.010%), and Immigrants from Western Europe (98.3%, a difference of 0.010%).
| Demographics | Rating | Rank | 1st Grade |
| Immigrants | Denmark | 99.0 /100 | #86 | Exceptional 98.3% |
| Immigrants | Australia | 99.0 /100 | #87 | Exceptional 98.3% |
| Zimbabweans | 98.9 /100 | #88 | Exceptional 98.3% |
| Immigrants | South Africa | 98.8 /100 | #89 | Exceptional 98.3% |
| Ukrainians | 98.8 /100 | #90 | Exceptional 98.3% |
| Immigrants | Western Europe | 98.8 /100 | #91 | Exceptional 98.3% |
| Macedonians | 98.7 /100 | #92 | Exceptional 98.3% |
| Immigrants | India | 98.6 /100 | #93 | Exceptional 98.2% |
| South Africans | 98.6 /100 | #94 | Exceptional 98.2% |
| Immigrants | Germany | 98.5 /100 | #95 | Exceptional 98.2% |
| Cypriots | 98.3 /100 | #96 | Exceptional 98.2% |
| Immigrants | Nonimmigrants | 98.3 /100 | #97 | Exceptional 98.2% |
| Choctaw | 98.3 /100 | #98 | Exceptional 98.2% |
| Puget Sound Salish | 98.2 /100 | #99 | Exceptional 98.2% |
| Colville | 98.0 /100 | #100 | Exceptional 98.2% |
Demographics Similar to Guamanians/Chamorros by 1st Grade
In terms of 1st grade, the demographic groups most similar to Guamanians/Chamorros are Immigrants from Kenya (97.8%, a difference of 0.0%), Immigrants from Taiwan (97.9%, a difference of 0.010%), Mongolian (97.9%, a difference of 0.010%), Hawaiian (97.9%, a difference of 0.010%), and Yuman (97.8%, a difference of 0.010%).
| Demographics | Rating | Rank | 1st Grade |
| Panamanians | 34.1 /100 | #190 | Fair 97.9% |
| Blacks/African Americans | 30.7 /100 | #191 | Fair 97.9% |
| Paraguayans | 30.2 /100 | #192 | Fair 97.9% |
| Immigrants | Taiwan | 29.4 /100 | #193 | Fair 97.9% |
| Mongolians | 29.2 /100 | #194 | Fair 97.9% |
| Hawaiians | 28.8 /100 | #195 | Fair 97.9% |
| Immigrants | Kenya | 26.3 /100 | #196 | Fair 97.8% |
| Guamanians/Chamorros | 26.2 /100 | #197 | Fair 97.8% |
| Yuman | 24.4 /100 | #198 | Fair 97.8% |
| Tohono O'odham | 23.2 /100 | #199 | Fair 97.8% |
| Immigrants | Egypt | 22.6 /100 | #200 | Fair 97.8% |
| Immigrants | Lebanon | 20.1 /100 | #201 | Fair 97.8% |
| Immigrants | Ukraine | 19.2 /100 | #202 | Poor 97.8% |
| Immigrants | Southern Europe | 18.2 /100 | #203 | Poor 97.8% |
| Immigrants | Uganda | 18.2 /100 | #204 | Poor 97.8% |