Immigrants from Hungary vs Ute 10th Grade
COMPARE
Immigrants from Hungary
Ute
10th Grade
10th Grade Comparison
Immigrants from Hungary
Ute
94.4%
10TH GRADE
95.8/ 100
METRIC RATING
117th/ 347
METRIC RANK
93.4%
10TH GRADE
20.3/ 100
METRIC RATING
204th/ 347
METRIC RANK
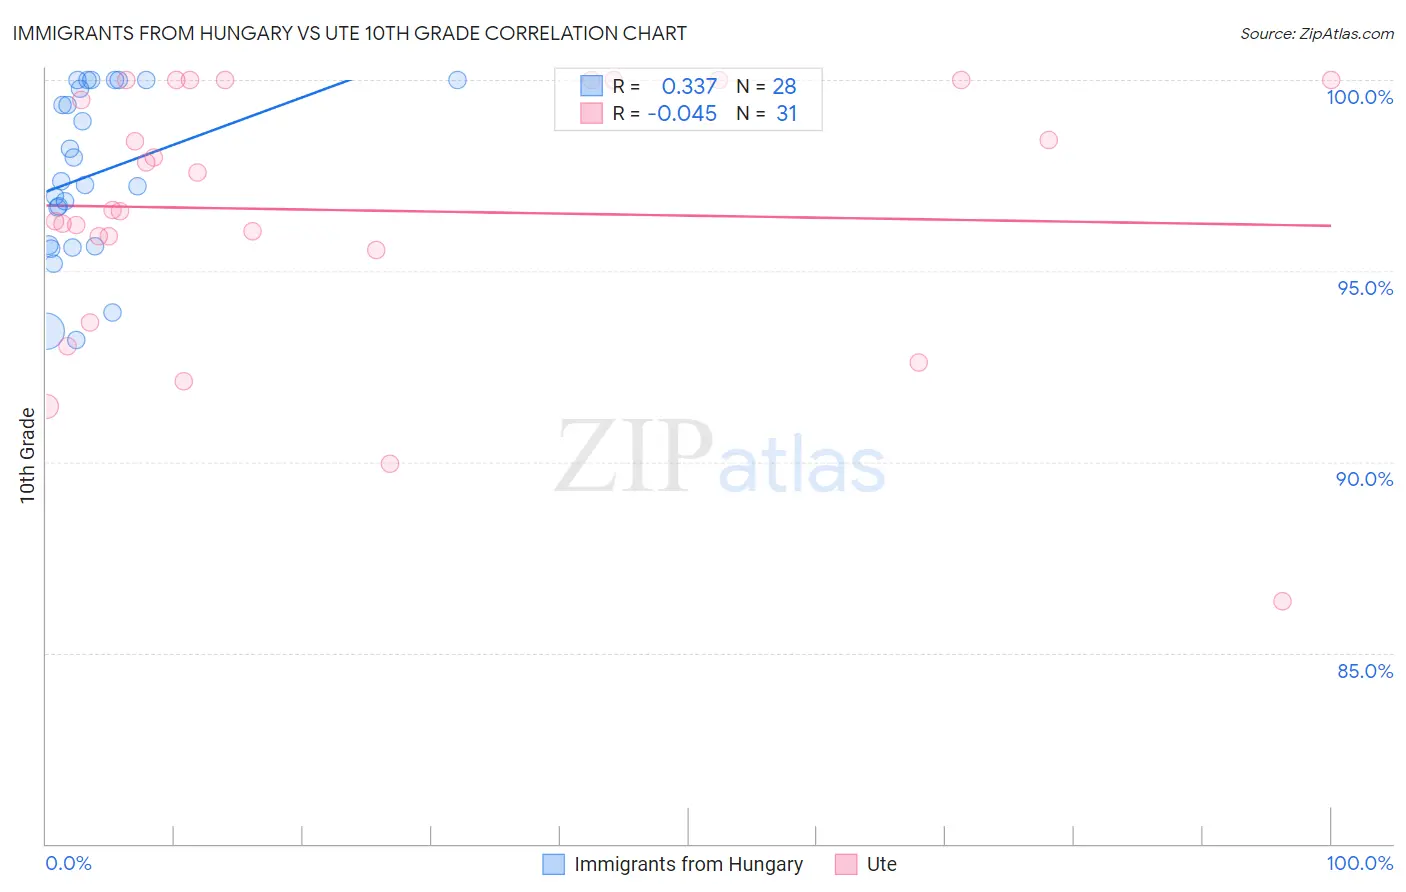
Immigrants from Hungary vs Ute 10th Grade Correlation Chart
The statistical analysis conducted on geographies consisting of 195,707,305 people shows a mild positive correlation between the proportion of Immigrants from Hungary and percentage of population with at least 10th grade education in the United States with a correlation coefficient (R) of 0.337 and weighted average of 94.4%. Similarly, the statistical analysis conducted on geographies consisting of 55,668,539 people shows no correlation between the proportion of Ute and percentage of population with at least 10th grade education in the United States with a correlation coefficient (R) of -0.045 and weighted average of 93.4%, a difference of 1.0%.
10th Grade Correlation Summary
| Measurement | Immigrants from Hungary | Ute |
| Minimum | 93.2% | 86.4% |
| Maximum | 100.0% | 100.0% |
| Range | 6.8% | 13.6% |
| Mean | 97.5% | 96.6% |
| Median | 97.3% | 96.6% |
| Interquartile 25% (IQ1) | 95.7% | 95.6% |
| Interquartile 75% (IQ3) | 99.9% | 100.0% |
| Interquartile Range (IQR) | 4.2% | 4.4% |
| Standard Deviation (Sample) | 2.2% | 3.5% |
| Standard Deviation (Population) | 2.1% | 3.4% |
Similar Demographics by 10th Grade
Demographics Similar to Immigrants from Hungary by 10th Grade
In terms of 10th grade, the demographic groups most similar to Immigrants from Hungary are Jordanian (94.4%, a difference of 0.010%), Immigrants from Israel (94.4%, a difference of 0.020%), German Russian (94.4%, a difference of 0.030%), Delaware (94.4%, a difference of 0.030%), and Sioux (94.4%, a difference of 0.030%).
| Demographics | Rating | Rank | 10th Grade |
| Burmese | 97.1 /100 | #110 | Exceptional 94.5% |
| Immigrants | Zimbabwe | 96.8 /100 | #111 | Exceptional 94.4% |
| Immigrants | Kuwait | 96.8 /100 | #112 | Exceptional 94.4% |
| Palestinians | 96.5 /100 | #113 | Exceptional 94.4% |
| German Russians | 96.3 /100 | #114 | Exceptional 94.4% |
| Delaware | 96.3 /100 | #115 | Exceptional 94.4% |
| Sioux | 96.2 /100 | #116 | Exceptional 94.4% |
| Immigrants | Hungary | 95.8 /100 | #117 | Exceptional 94.4% |
| Jordanians | 95.6 /100 | #118 | Exceptional 94.4% |
| Immigrants | Israel | 95.4 /100 | #119 | Exceptional 94.4% |
| Immigrants | Taiwan | 95.3 /100 | #120 | Exceptional 94.4% |
| Immigrants | Belarus | 95.2 /100 | #121 | Exceptional 94.4% |
| Inupiat | 95.1 /100 | #122 | Exceptional 94.4% |
| Cree | 95.1 /100 | #123 | Exceptional 94.4% |
| Basques | 94.9 /100 | #124 | Exceptional 94.3% |
Demographics Similar to Ute by 10th Grade
In terms of 10th grade, the demographic groups most similar to Ute are Immigrants from Western Asia (93.4%, a difference of 0.0%), Immigrants from Indonesia (93.4%, a difference of 0.0%), Immigrants from Sudan (93.4%, a difference of 0.0%), Immigrants from Uganda (93.5%, a difference of 0.010%), and Samoan (93.4%, a difference of 0.010%).
| Demographics | Rating | Rank | 10th Grade |
| Pueblo | 23.9 /100 | #197 | Fair 93.5% |
| Immigrants | Micronesia | 23.2 /100 | #198 | Fair 93.5% |
| Asians | 23.0 /100 | #199 | Fair 93.5% |
| Hopi | 22.2 /100 | #200 | Fair 93.5% |
| Hawaiians | 21.8 /100 | #201 | Fair 93.5% |
| Immigrants | Uganda | 20.9 /100 | #202 | Fair 93.5% |
| Immigrants | Western Asia | 20.6 /100 | #203 | Fair 93.4% |
| Ute | 20.3 /100 | #204 | Fair 93.4% |
| Immigrants | Indonesia | 20.2 /100 | #205 | Fair 93.4% |
| Immigrants | Sudan | 20.0 /100 | #206 | Fair 93.4% |
| Samoans | 19.5 /100 | #207 | Poor 93.4% |
| Immigrants | Syria | 19.4 /100 | #208 | Poor 93.4% |
| Immigrants | Chile | 18.8 /100 | #209 | Poor 93.4% |
| Indians (Asian) | 17.6 /100 | #210 | Poor 93.4% |
| Cajuns | 16.9 /100 | #211 | Poor 93.4% |