Immigrants from Hungary vs Immigrants from Western Africa 7th Grade
COMPARE
Immigrants from Hungary
Immigrants from Western Africa
7th Grade
7th Grade Comparison
Immigrants from Hungary
Immigrants from Western Africa
96.4%
7TH GRADE
90.6/ 100
METRIC RATING
136th/ 347
METRIC RANK
95.1%
7TH GRADE
0.2/ 100
METRIC RATING
274th/ 347
METRIC RANK
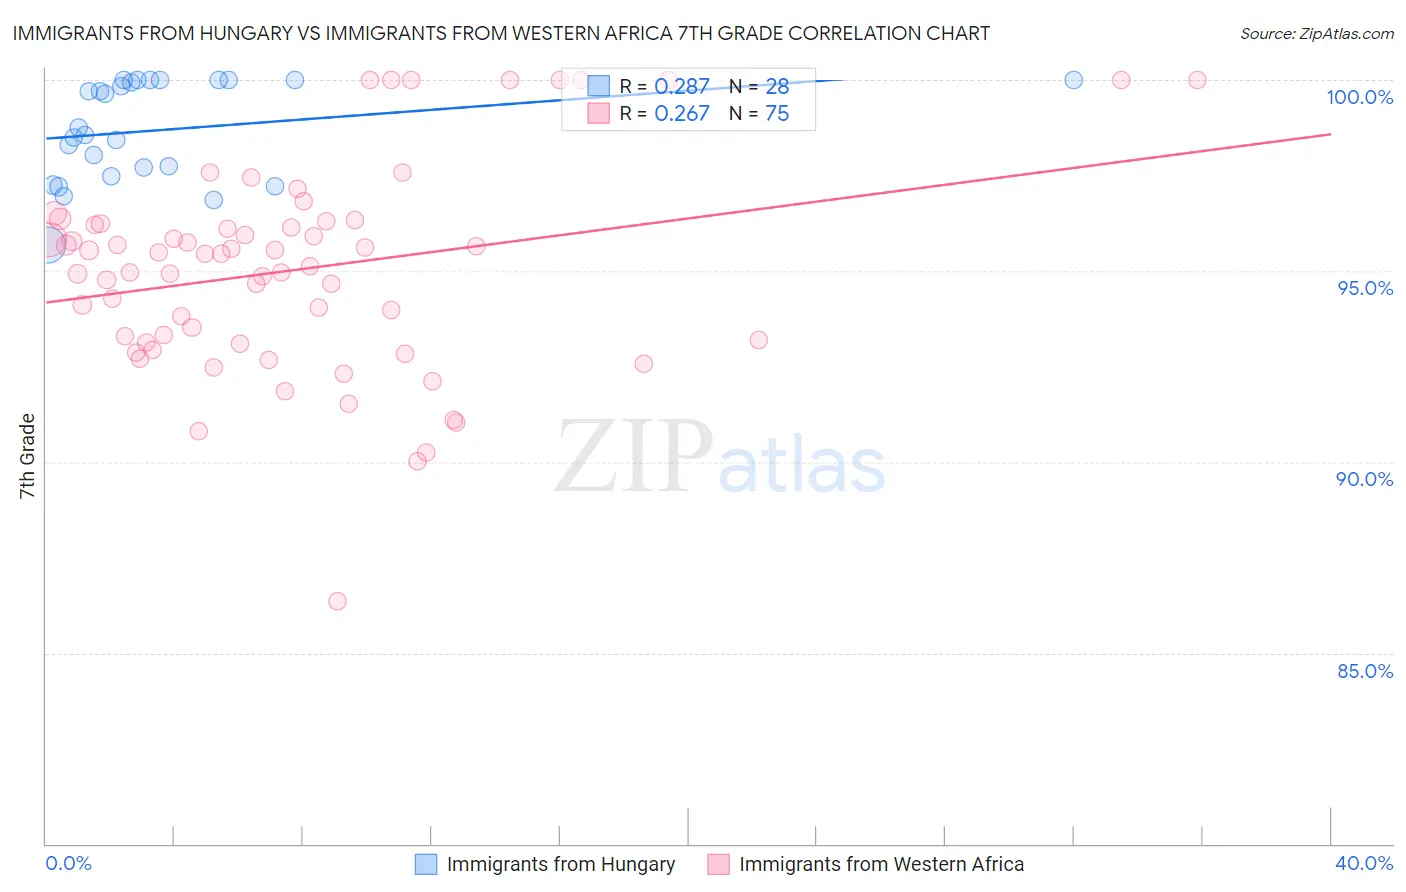
Immigrants from Hungary vs Immigrants from Western Africa 7th Grade Correlation Chart
The statistical analysis conducted on geographies consisting of 195,707,305 people shows a weak positive correlation between the proportion of Immigrants from Hungary and percentage of population with at least 7th grade education in the United States with a correlation coefficient (R) of 0.287 and weighted average of 96.4%. Similarly, the statistical analysis conducted on geographies consisting of 357,883,667 people shows a weak positive correlation between the proportion of Immigrants from Western Africa and percentage of population with at least 7th grade education in the United States with a correlation coefficient (R) of 0.267 and weighted average of 95.1%, a difference of 1.3%.
7th Grade Correlation Summary
| Measurement | Immigrants from Hungary | Immigrants from Western Africa |
| Minimum | 95.7% | 86.4% |
| Maximum | 100.0% | 100.0% |
| Range | 4.3% | 13.6% |
| Mean | 98.7% | 95.0% |
| Median | 98.7% | 95.4% |
| Interquartile 25% (IQ1) | 97.6% | 93.1% |
| Interquartile 75% (IQ3) | 100.0% | 96.2% |
| Interquartile Range (IQR) | 2.4% | 3.1% |
| Standard Deviation (Sample) | 1.3% | 2.7% |
| Standard Deviation (Population) | 1.3% | 2.7% |
Similar Demographics by 7th Grade
Demographics Similar to Immigrants from Hungary by 7th Grade
In terms of 7th grade, the demographic groups most similar to Immigrants from Hungary are Soviet Union (96.4%, a difference of 0.010%), Immigrants from Kuwait (96.4%, a difference of 0.010%), Immigrants from Turkey (96.4%, a difference of 0.010%), Jordanian (96.4%, a difference of 0.010%), and Colville (96.4%, a difference of 0.020%).
| Demographics | Rating | Rank | 7th Grade |
| Immigrants | North Macedonia | 93.1 /100 | #129 | Exceptional 96.4% |
| Immigrants | Serbia | 92.8 /100 | #130 | Exceptional 96.4% |
| Filipinos | 92.1 /100 | #131 | Exceptional 96.4% |
| Colville | 91.7 /100 | #132 | Exceptional 96.4% |
| Hmong | 91.5 /100 | #133 | Exceptional 96.4% |
| Soviet Union | 91.2 /100 | #134 | Exceptional 96.4% |
| Immigrants | Kuwait | 91.1 /100 | #135 | Exceptional 96.4% |
| Immigrants | Hungary | 90.6 /100 | #136 | Exceptional 96.4% |
| Immigrants | Turkey | 90.2 /100 | #137 | Exceptional 96.4% |
| Jordanians | 90.0 /100 | #138 | Excellent 96.4% |
| Basques | 89.3 /100 | #139 | Excellent 96.4% |
| Cambodians | 88.3 /100 | #140 | Excellent 96.3% |
| Immigrants | South Central Asia | 87.1 /100 | #141 | Excellent 96.3% |
| Burmese | 87.1 /100 | #142 | Excellent 96.3% |
| Spanish | 86.6 /100 | #143 | Excellent 96.3% |
Demographics Similar to Immigrants from Western Africa by 7th Grade
In terms of 7th grade, the demographic groups most similar to Immigrants from Western Africa are Immigrants from Uzbekistan (95.1%, a difference of 0.0%), Houma (95.1%, a difference of 0.010%), Immigrants from South America (95.1%, a difference of 0.010%), Peruvian (95.1%, a difference of 0.010%), and Immigrants from Colombia (95.1%, a difference of 0.010%).
| Demographics | Rating | Rank | 7th Grade |
| Yuman | 0.3 /100 | #267 | Tragic 95.2% |
| Immigrants | Hong Kong | 0.3 /100 | #268 | Tragic 95.2% |
| Trinidadians and Tobagonians | 0.3 /100 | #269 | Tragic 95.2% |
| Houma | 0.2 /100 | #270 | Tragic 95.1% |
| Immigrants | South America | 0.2 /100 | #271 | Tragic 95.1% |
| Peruvians | 0.2 /100 | #272 | Tragic 95.1% |
| Immigrants | Uzbekistan | 0.2 /100 | #273 | Tragic 95.1% |
| Immigrants | Western Africa | 0.2 /100 | #274 | Tragic 95.1% |
| Immigrants | Colombia | 0.2 /100 | #275 | Tragic 95.1% |
| Immigrants | Thailand | 0.2 /100 | #276 | Tragic 95.1% |
| Immigrants | Afghanistan | 0.2 /100 | #277 | Tragic 95.1% |
| Immigrants | Trinidad and Tobago | 0.1 /100 | #278 | Tragic 95.1% |
| Barbadians | 0.1 /100 | #279 | Tragic 95.1% |
| Immigrants | St. Vincent and the Grenadines | 0.1 /100 | #280 | Tragic 95.0% |
| Tohono O'odham | 0.1 /100 | #281 | Tragic 95.0% |