Immigrants from Hungary vs Immigrants from Nicaragua Kindergarten
COMPARE
Immigrants from Hungary
Immigrants from Nicaragua
Kindergarten
Kindergarten Comparison
Immigrants from Hungary
Immigrants from Nicaragua
98.1%
KINDERGARTEN
89.1/ 100
METRIC RATING
136th/ 347
METRIC RANK
96.9%
KINDERGARTEN
0.0/ 100
METRIC RATING
316th/ 347
METRIC RANK
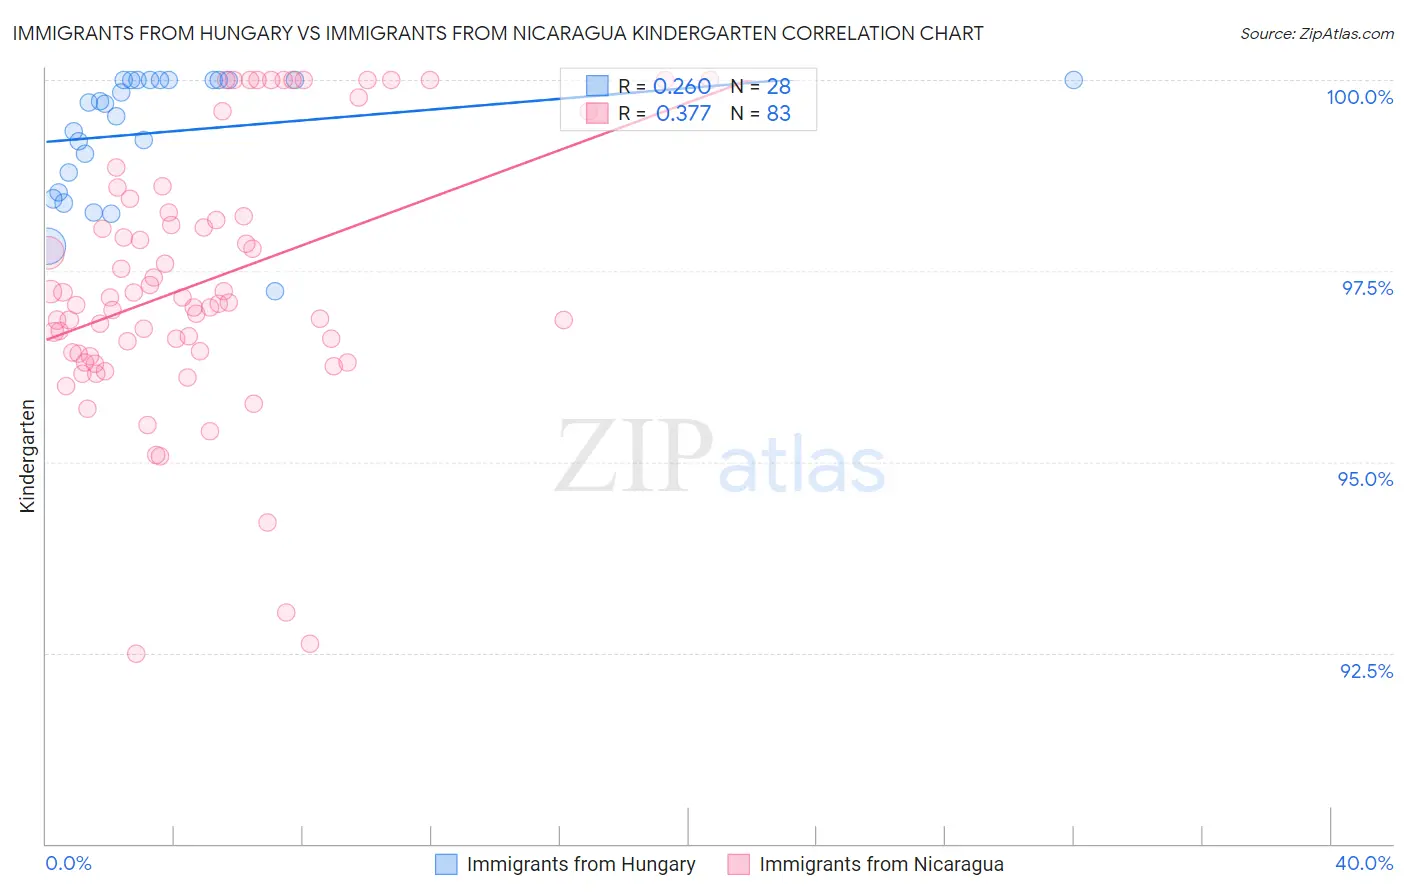
Immigrants from Hungary vs Immigrants from Nicaragua Kindergarten Correlation Chart
The statistical analysis conducted on geographies consisting of 195,707,305 people shows a weak positive correlation between the proportion of Immigrants from Hungary and percentage of population with at least kindergarten education in the United States with a correlation coefficient (R) of 0.260 and weighted average of 98.1%. Similarly, the statistical analysis conducted on geographies consisting of 236,332,861 people shows a mild positive correlation between the proportion of Immigrants from Nicaragua and percentage of population with at least kindergarten education in the United States with a correlation coefficient (R) of 0.377 and weighted average of 96.9%, a difference of 1.3%.
Kindergarten Correlation Summary
| Measurement | Immigrants from Hungary | Immigrants from Nicaragua |
| Minimum | 97.2% | 92.5% |
| Maximum | 100.0% | 100.0% |
| Range | 2.8% | 7.5% |
| Mean | 99.3% | 97.4% |
| Median | 99.7% | 97.1% |
| Interquartile 25% (IQ1) | 98.7% | 96.4% |
| Interquartile 75% (IQ3) | 100.0% | 98.3% |
| Interquartile Range (IQR) | 1.3% | 1.8% |
| Standard Deviation (Sample) | 0.80% | 1.7% |
| Standard Deviation (Population) | 0.79% | 1.7% |
Similar Demographics by Kindergarten
Demographics Similar to Immigrants from Hungary by Kindergarten
In terms of kindergarten, the demographic groups most similar to Immigrants from Hungary are Immigrants from Bulgaria (98.1%, a difference of 0.0%), Immigrants from Kuwait (98.1%, a difference of 0.0%), Immigrants from Europe (98.1%, a difference of 0.010%), Blackfeet (98.1%, a difference of 0.010%), and Immigrants from Romania (98.1%, a difference of 0.010%).
| Demographics | Rating | Rank | Kindergarten |
| Seminole | 91.5 /100 | #129 | Exceptional 98.1% |
| Immigrants | Croatia | 91.2 /100 | #130 | Exceptional 98.1% |
| Cambodians | 91.2 /100 | #131 | Exceptional 98.1% |
| Spaniards | 91.0 /100 | #132 | Exceptional 98.1% |
| Immigrants | Europe | 90.4 /100 | #133 | Exceptional 98.1% |
| Immigrants | Bulgaria | 89.4 /100 | #134 | Excellent 98.1% |
| Immigrants | Kuwait | 89.2 /100 | #135 | Excellent 98.1% |
| Immigrants | Hungary | 89.1 /100 | #136 | Excellent 98.1% |
| Blackfeet | 87.8 /100 | #137 | Excellent 98.1% |
| Immigrants | Romania | 87.7 /100 | #138 | Excellent 98.1% |
| Israelis | 87.7 /100 | #139 | Excellent 98.1% |
| Palestinians | 83.6 /100 | #140 | Excellent 98.1% |
| Marshallese | 83.0 /100 | #141 | Excellent 98.1% |
| Immigrants | Turkey | 82.8 /100 | #142 | Excellent 98.1% |
| Burmese | 81.5 /100 | #143 | Excellent 98.1% |
Demographics Similar to Immigrants from Nicaragua by Kindergarten
In terms of kindergarten, the demographic groups most similar to Immigrants from Nicaragua are Immigrants from Ecuador (96.9%, a difference of 0.0%), Immigrants from Belize (96.9%, a difference of 0.010%), Honduran (96.9%, a difference of 0.020%), Cape Verdean (96.9%, a difference of 0.030%), and Guyanese (96.9%, a difference of 0.040%).
| Demographics | Rating | Rank | Kindergarten |
| Immigrants | Haiti | 0.0 /100 | #309 | Tragic 97.0% |
| Immigrants | Azores | 0.0 /100 | #310 | Tragic 97.0% |
| Sri Lankans | 0.0 /100 | #311 | Tragic 97.0% |
| Guyanese | 0.0 /100 | #312 | Tragic 96.9% |
| Cape Verdeans | 0.0 /100 | #313 | Tragic 96.9% |
| Hondurans | 0.0 /100 | #314 | Tragic 96.9% |
| Immigrants | Belize | 0.0 /100 | #315 | Tragic 96.9% |
| Immigrants | Nicaragua | 0.0 /100 | #316 | Tragic 96.9% |
| Immigrants | Ecuador | 0.0 /100 | #317 | Tragic 96.9% |
| Immigrants | Laos | 0.0 /100 | #318 | Tragic 96.9% |
| Immigrants | Guyana | 0.0 /100 | #319 | Tragic 96.8% |
| Immigrants | Burma/Myanmar | 0.0 /100 | #320 | Tragic 96.8% |
| Immigrants | Bangladesh | 0.0 /100 | #321 | Tragic 96.8% |
| Mexican American Indians | 0.0 /100 | #322 | Tragic 96.8% |
| Immigrants | Honduras | 0.0 /100 | #323 | Tragic 96.8% |