Immigrants from Hong Kong vs Immigrants from North America 8th Grade
COMPARE
Immigrants from Hong Kong
Immigrants from North America
8th Grade
8th Grade Comparison
Immigrants from Hong Kong
Immigrants from North America
94.9%
8TH GRADE
0.4/ 100
METRIC RATING
263rd/ 347
METRIC RANK
96.7%
8TH GRADE
99.8/ 100
METRIC RATING
59th/ 347
METRIC RANK
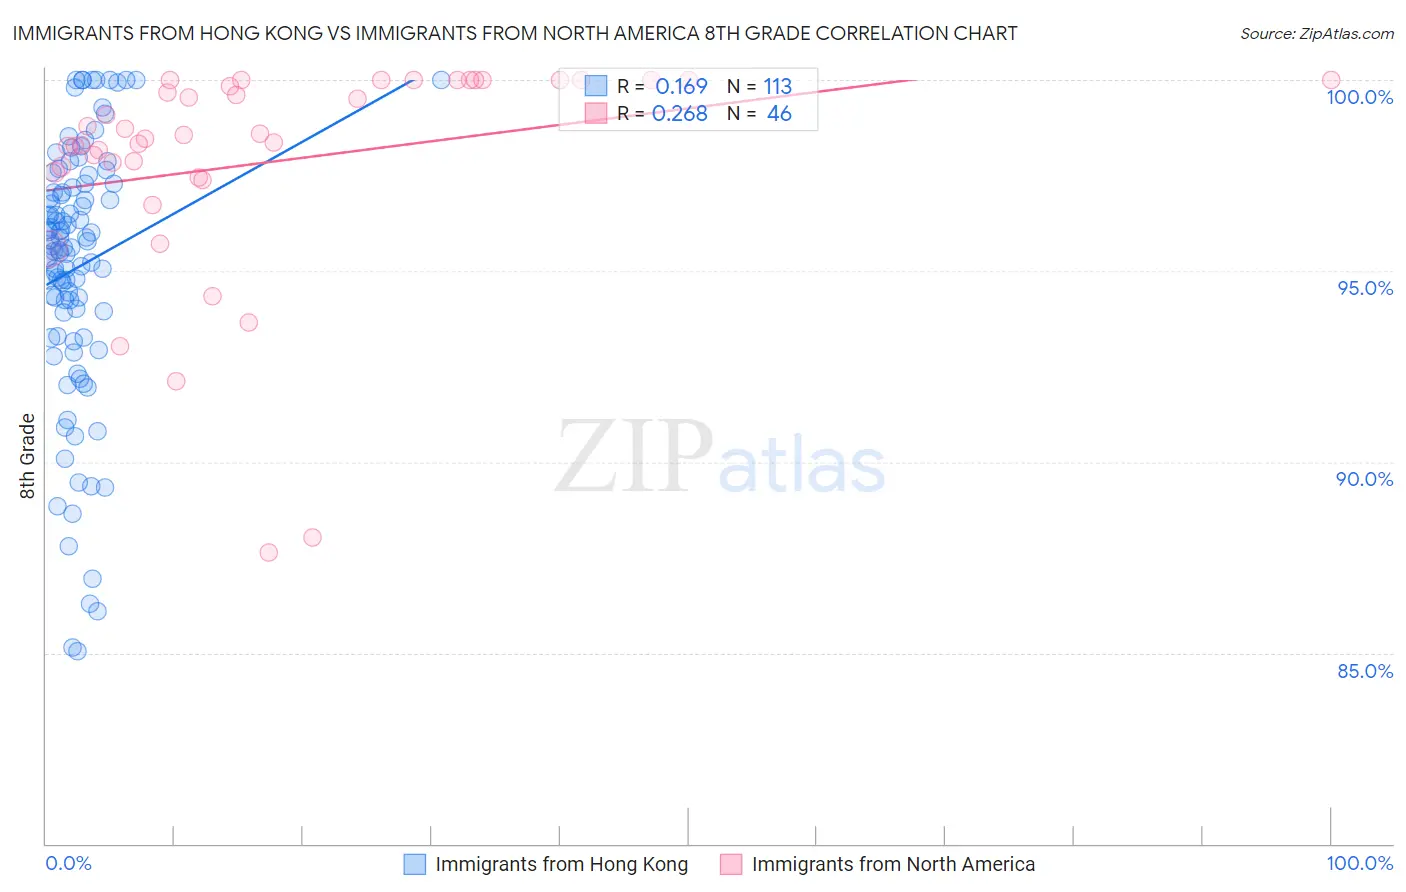
Immigrants from Hong Kong vs Immigrants from North America 8th Grade Correlation Chart
The statistical analysis conducted on geographies consisting of 253,990,382 people shows a poor positive correlation between the proportion of Immigrants from Hong Kong and percentage of population with at least 8th grade education in the United States with a correlation coefficient (R) of 0.169 and weighted average of 94.9%. Similarly, the statistical analysis conducted on geographies consisting of 462,462,330 people shows a weak positive correlation between the proportion of Immigrants from North America and percentage of population with at least 8th grade education in the United States with a correlation coefficient (R) of 0.268 and weighted average of 96.7%, a difference of 1.9%.
8th Grade Correlation Summary
| Measurement | Immigrants from Hong Kong | Immigrants from North America |
| Minimum | 85.0% | 87.6% |
| Maximum | 100.0% | 100.0% |
| Range | 15.0% | 12.4% |
| Mean | 95.1% | 97.8% |
| Median | 95.6% | 98.5% |
| Interquartile 25% (IQ1) | 93.6% | 97.6% |
| Interquartile 75% (IQ3) | 97.2% | 100.0% |
| Interquartile Range (IQR) | 3.6% | 2.4% |
| Standard Deviation (Sample) | 3.4% | 2.9% |
| Standard Deviation (Population) | 3.4% | 2.9% |
Similar Demographics by 8th Grade
Demographics Similar to Immigrants from Hong Kong by 8th Grade
In terms of 8th grade, the demographic groups most similar to Immigrants from Hong Kong are South American (94.9%, a difference of 0.0%), Immigrants from Nigeria (94.9%, a difference of 0.010%), Yuman (94.9%, a difference of 0.010%), Immigrants from Costa Rica (94.9%, a difference of 0.020%), and West Indian (94.8%, a difference of 0.050%).
| Demographics | Rating | Rank | 8th Grade |
| Colombians | 0.7 /100 | #256 | Tragic 95.0% |
| Afghans | 0.6 /100 | #257 | Tragic 94.9% |
| Immigrants | Congo | 0.6 /100 | #258 | Tragic 94.9% |
| Ghanaians | 0.6 /100 | #259 | Tragic 94.9% |
| Immigrants | Jamaica | 0.6 /100 | #260 | Tragic 94.9% |
| Immigrants | Costa Rica | 0.5 /100 | #261 | Tragic 94.9% |
| Immigrants | Nigeria | 0.4 /100 | #262 | Tragic 94.9% |
| Immigrants | Hong Kong | 0.4 /100 | #263 | Tragic 94.9% |
| South Americans | 0.4 /100 | #264 | Tragic 94.9% |
| Yuman | 0.4 /100 | #265 | Tragic 94.9% |
| West Indians | 0.3 /100 | #266 | Tragic 94.8% |
| Immigrants | Ghana | 0.3 /100 | #267 | Tragic 94.8% |
| Immigrants | Uruguay | 0.3 /100 | #268 | Tragic 94.8% |
| Immigrants | Thailand | 0.2 /100 | #269 | Tragic 94.8% |
| Immigrants | Uzbekistan | 0.2 /100 | #270 | Tragic 94.8% |
Demographics Similar to Immigrants from North America by 8th Grade
In terms of 8th grade, the demographic groups most similar to Immigrants from North America are Immigrants from Northern Europe (96.7%, a difference of 0.0%), Immigrants from Canada (96.7%, a difference of 0.010%), Immigrants from Austria (96.7%, a difference of 0.010%), White/Caucasian (96.7%, a difference of 0.020%), and Ukrainian (96.7%, a difference of 0.030%).
| Demographics | Rating | Rank | 8th Grade |
| Greeks | 99.9 /100 | #52 | Exceptional 96.8% |
| Austrians | 99.9 /100 | #53 | Exceptional 96.7% |
| Serbians | 99.8 /100 | #54 | Exceptional 96.7% |
| Russians | 99.8 /100 | #55 | Exceptional 96.7% |
| Australians | 99.8 /100 | #56 | Exceptional 96.7% |
| Macedonians | 99.8 /100 | #57 | Exceptional 96.7% |
| Immigrants | Canada | 99.8 /100 | #58 | Exceptional 96.7% |
| Immigrants | North America | 99.8 /100 | #59 | Exceptional 96.7% |
| Immigrants | Northern Europe | 99.8 /100 | #60 | Exceptional 96.7% |
| Immigrants | Austria | 99.8 /100 | #61 | Exceptional 96.7% |
| Whites/Caucasians | 99.8 /100 | #62 | Exceptional 96.7% |
| Ukrainians | 99.7 /100 | #63 | Exceptional 96.7% |
| Immigrants | India | 99.7 /100 | #64 | Exceptional 96.6% |
| Native Hawaiians | 99.7 /100 | #65 | Exceptional 96.6% |
| Canadians | 99.7 /100 | #66 | Exceptional 96.6% |