Immigrants from Hong Kong vs Canadian Doctorate Degree
COMPARE
Immigrants from Hong Kong
Canadian
Doctorate Degree
Doctorate Degree Comparison
Immigrants from Hong Kong
Canadians
2.8%
DOCTORATE DEGREE
100.0/ 100
METRIC RATING
20th/ 347
METRIC RANK
2.0%
DOCTORATE DEGREE
90.6/ 100
METRIC RATING
129th/ 347
METRIC RANK
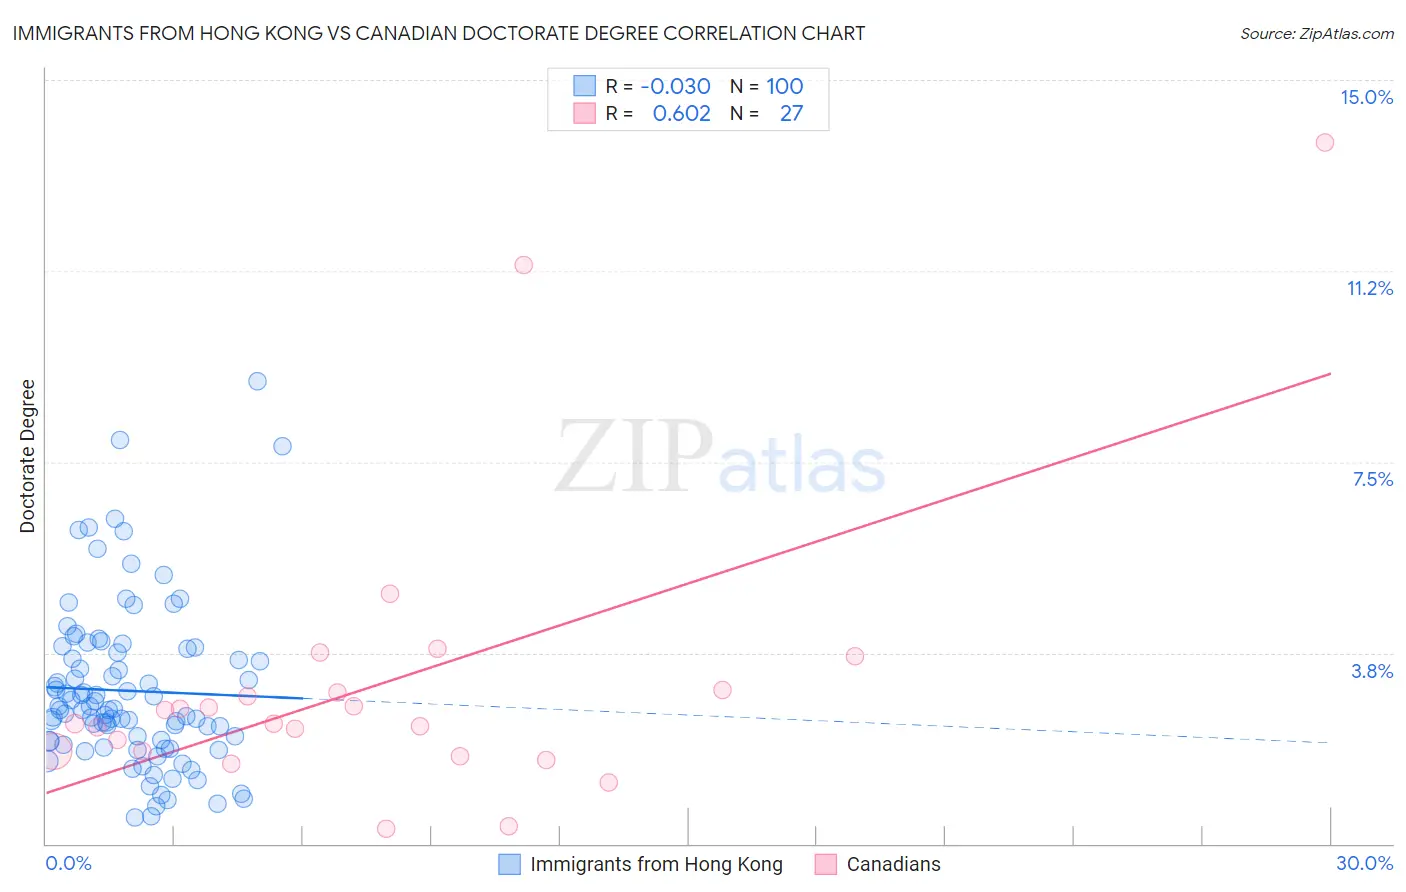
Immigrants from Hong Kong vs Canadian Doctorate Degree Correlation Chart
The statistical analysis conducted on geographies consisting of 253,283,148 people shows no correlation between the proportion of Immigrants from Hong Kong and percentage of population with at least doctorate degree education in the United States with a correlation coefficient (R) of -0.030 and weighted average of 2.8%. Similarly, the statistical analysis conducted on geographies consisting of 431,466,158 people shows a significant positive correlation between the proportion of Canadians and percentage of population with at least doctorate degree education in the United States with a correlation coefficient (R) of 0.602 and weighted average of 2.0%, a difference of 39.4%.
Doctorate Degree Correlation Summary
| Measurement | Immigrants from Hong Kong | Canadian |
| Minimum | 0.52% | 0.28% |
| Maximum | 9.1% | 13.8% |
| Range | 8.5% | 13.5% |
| Mean | 3.0% | 3.1% |
| Median | 2.6% | 2.4% |
| Interquartile 25% (IQ1) | 2.0% | 1.8% |
| Interquartile 75% (IQ3) | 3.8% | 3.0% |
| Interquartile Range (IQR) | 1.8% | 1.2% |
| Standard Deviation (Sample) | 1.6% | 2.9% |
| Standard Deviation (Population) | 1.6% | 2.9% |
Similar Demographics by Doctorate Degree
Demographics Similar to Immigrants from Hong Kong by Doctorate Degree
In terms of doctorate degree, the demographic groups most similar to Immigrants from Hong Kong are Immigrants from Japan (2.8%, a difference of 0.35%), Thai (2.8%, a difference of 0.35%), Mongolian (2.8%, a difference of 0.55%), Immigrants from Denmark (2.8%, a difference of 0.68%), and Immigrants from Sri Lanka (2.8%, a difference of 0.73%).
| Demographics | Rating | Rank | Doctorate Degree |
| Immigrants | Sweden | 100.0 /100 | #13 | Exceptional 2.9% |
| Immigrants | France | 100.0 /100 | #14 | Exceptional 2.9% |
| Immigrants | India | 100.0 /100 | #15 | Exceptional 2.8% |
| Eastern Europeans | 100.0 /100 | #16 | Exceptional 2.8% |
| Immigrants | Australia | 100.0 /100 | #17 | Exceptional 2.8% |
| Immigrants | Sri Lanka | 100.0 /100 | #18 | Exceptional 2.8% |
| Immigrants | Japan | 100.0 /100 | #19 | Exceptional 2.8% |
| Immigrants | Hong Kong | 100.0 /100 | #20 | Exceptional 2.8% |
| Thais | 100.0 /100 | #21 | Exceptional 2.8% |
| Mongolians | 100.0 /100 | #22 | Exceptional 2.8% |
| Immigrants | Denmark | 100.0 /100 | #23 | Exceptional 2.8% |
| Israelis | 100.0 /100 | #24 | Exceptional 2.7% |
| Immigrants | Saudi Arabia | 100.0 /100 | #25 | Exceptional 2.7% |
| Turks | 100.0 /100 | #26 | Exceptional 2.7% |
| Immigrants | Turkey | 100.0 /100 | #27 | Exceptional 2.6% |
Demographics Similar to Canadians by Doctorate Degree
In terms of doctorate degree, the demographic groups most similar to Canadians are Immigrants from Ukraine (2.0%, a difference of 0.010%), Immigrants from Sierra Leone (2.0%, a difference of 0.14%), Immigrants from Zaire (2.0%, a difference of 0.22%), Scottish (2.0%, a difference of 0.42%), and Immigrants from Uzbekistan (2.0%, a difference of 0.47%).
| Demographics | Rating | Rank | Doctorate Degree |
| Immigrants | Southern Europe | 94.7 /100 | #122 | Exceptional 2.0% |
| Croatians | 94.0 /100 | #123 | Exceptional 2.0% |
| Ute | 93.2 /100 | #124 | Exceptional 2.0% |
| Moroccans | 93.0 /100 | #125 | Exceptional 2.0% |
| Jordanians | 92.1 /100 | #126 | Exceptional 2.0% |
| Palestinians | 92.0 /100 | #127 | Exceptional 2.0% |
| Immigrants | Zaire | 91.1 /100 | #128 | Exceptional 2.0% |
| Canadians | 90.6 /100 | #129 | Exceptional 2.0% |
| Immigrants | Ukraine | 90.5 /100 | #130 | Exceptional 2.0% |
| Immigrants | Sierra Leone | 90.2 /100 | #131 | Exceptional 2.0% |
| Scottish | 89.4 /100 | #132 | Excellent 2.0% |
| Immigrants | Uzbekistan | 89.3 /100 | #133 | Excellent 2.0% |
| Immigrants | Cameroon | 88.9 /100 | #134 | Excellent 2.0% |
| Serbians | 88.7 /100 | #135 | Excellent 2.0% |
| Swedes | 88.3 /100 | #136 | Excellent 2.0% |