Immigrants from Honduras vs Immigrants from South America High School Diploma
COMPARE
Immigrants from Honduras
Immigrants from South America
High School Diploma
High School Diploma Comparison
Immigrants from Honduras
Immigrants from South America
82.5%
HIGH SCHOOL DIPLOMA
0.0/ 100
METRIC RATING
332nd/ 347
METRIC RANK
87.6%
HIGH SCHOOL DIPLOMA
1.2/ 100
METRIC RATING
252nd/ 347
METRIC RANK
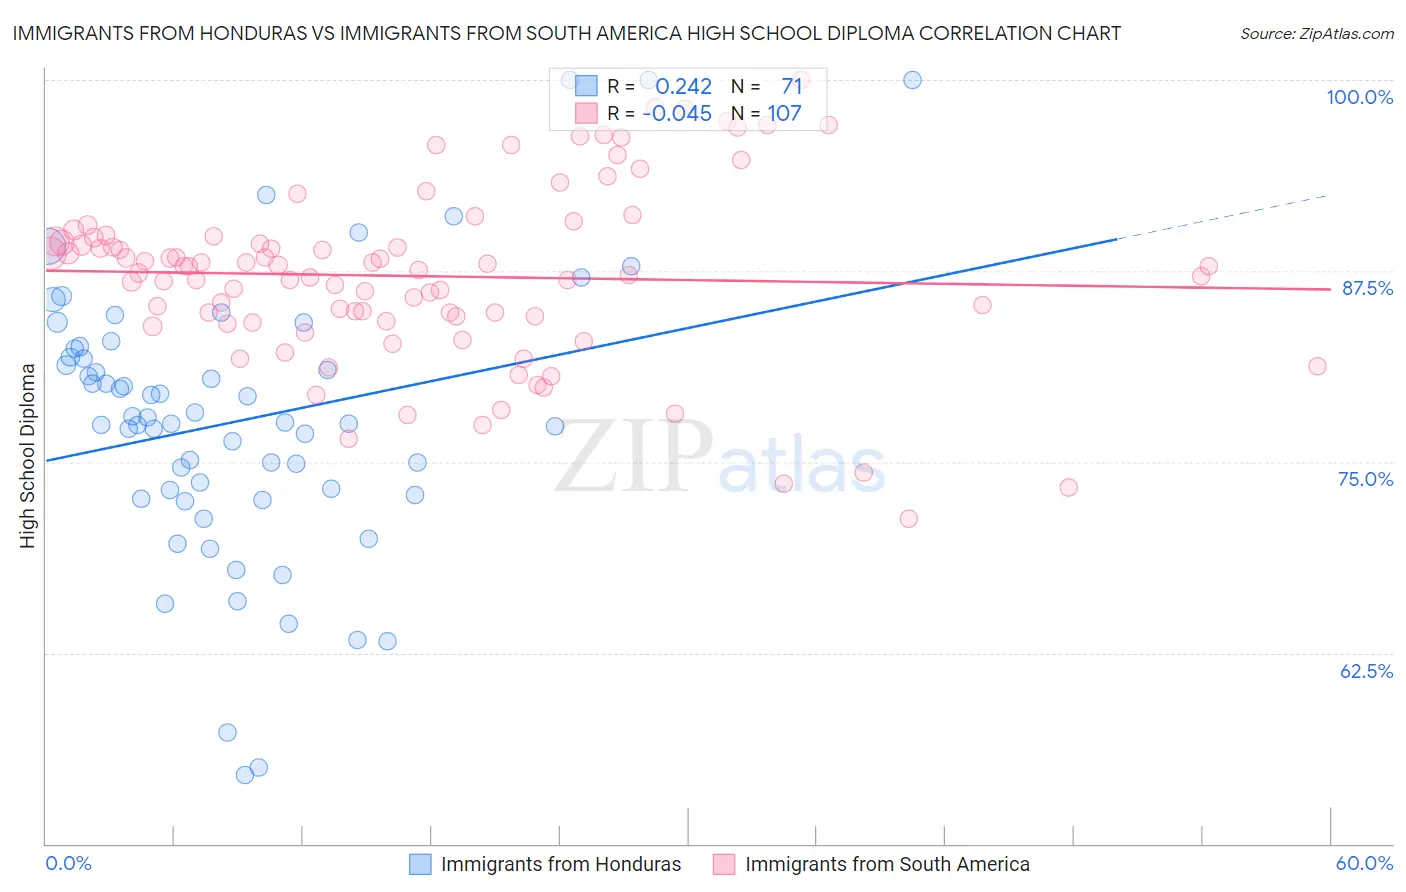
Immigrants from Honduras vs Immigrants from South America High School Diploma Correlation Chart
The statistical analysis conducted on geographies consisting of 322,637,368 people shows a weak positive correlation between the proportion of Immigrants from Honduras and percentage of population with at least high school diploma education in the United States with a correlation coefficient (R) of 0.242 and weighted average of 82.5%. Similarly, the statistical analysis conducted on geographies consisting of 486,312,594 people shows no correlation between the proportion of Immigrants from South America and percentage of population with at least high school diploma education in the United States with a correlation coefficient (R) of -0.045 and weighted average of 87.6%, a difference of 6.3%.
High School Diploma Correlation Summary
| Measurement | Immigrants from Honduras | Immigrants from South America |
| Minimum | 54.5% | 71.3% |
| Maximum | 100.0% | 100.0% |
| Range | 45.5% | 28.7% |
| Mean | 77.7% | 87.2% |
| Median | 77.6% | 87.5% |
| Interquartile 25% (IQ1) | 72.8% | 84.2% |
| Interquartile 75% (IQ3) | 82.4% | 89.7% |
| Interquartile Range (IQR) | 9.6% | 5.5% |
| Standard Deviation (Sample) | 9.1% | 5.7% |
| Standard Deviation (Population) | 9.1% | 5.7% |
Similar Demographics by High School Diploma
Demographics Similar to Immigrants from Honduras by High School Diploma
In terms of high school diploma, the demographic groups most similar to Immigrants from Honduras are Central American (82.5%, a difference of 0.10%), Immigrants from Latin America (82.1%, a difference of 0.39%), Immigrants from the Azores (82.8%, a difference of 0.41%), Hispanic or Latino (82.9%, a difference of 0.49%), and Tohono O'odham (82.1%, a difference of 0.50%).
| Demographics | Rating | Rank | High School Diploma |
| Immigrants | Nicaragua | 0.0 /100 | #325 | Tragic 83.1% |
| Mexican American Indians | 0.0 /100 | #326 | Tragic 83.0% |
| Hondurans | 0.0 /100 | #327 | Tragic 83.0% |
| Dominicans | 0.0 /100 | #328 | Tragic 82.9% |
| Hispanics or Latinos | 0.0 /100 | #329 | Tragic 82.9% |
| Immigrants | Azores | 0.0 /100 | #330 | Tragic 82.8% |
| Central Americans | 0.0 /100 | #331 | Tragic 82.5% |
| Immigrants | Honduras | 0.0 /100 | #332 | Tragic 82.5% |
| Immigrants | Latin America | 0.0 /100 | #333 | Tragic 82.1% |
| Tohono O'odham | 0.0 /100 | #334 | Tragic 82.1% |
| Guatemalans | 0.0 /100 | #335 | Tragic 82.0% |
| Immigrants | Dominican Republic | 0.0 /100 | #336 | Tragic 82.0% |
| Immigrants | Yemen | 0.0 /100 | #337 | Tragic 81.8% |
| Salvadorans | 0.0 /100 | #338 | Tragic 81.7% |
| Pima | 0.0 /100 | #339 | Tragic 81.6% |
Demographics Similar to Immigrants from South America by High School Diploma
In terms of high school diploma, the demographic groups most similar to Immigrants from South America are Immigrants from Uruguay (87.6%, a difference of 0.050%), Immigrants from Colombia (87.6%, a difference of 0.050%), Ghanaian (87.7%, a difference of 0.060%), Senegalese (87.7%, a difference of 0.10%), and Immigrants from Nigeria (87.7%, a difference of 0.10%).
| Demographics | Rating | Rank | High School Diploma |
| Peruvians | 1.9 /100 | #245 | Tragic 87.8% |
| Immigrants | Eritrea | 1.7 /100 | #246 | Tragic 87.8% |
| Immigrants | Costa Rica | 1.7 /100 | #247 | Tragic 87.8% |
| Spanish Americans | 1.5 /100 | #248 | Tragic 87.7% |
| Senegalese | 1.5 /100 | #249 | Tragic 87.7% |
| Immigrants | Nigeria | 1.5 /100 | #250 | Tragic 87.7% |
| Ghanaians | 1.4 /100 | #251 | Tragic 87.7% |
| Immigrants | South America | 1.2 /100 | #252 | Tragic 87.6% |
| Immigrants | Uruguay | 1.0 /100 | #253 | Tragic 87.6% |
| Immigrants | Colombia | 1.0 /100 | #254 | Tragic 87.6% |
| Immigrants | Senegal | 0.9 /100 | #255 | Tragic 87.6% |
| Africans | 0.7 /100 | #256 | Tragic 87.5% |
| Bahamians | 0.7 /100 | #257 | Tragic 87.5% |
| Immigrants | Ghana | 0.5 /100 | #258 | Tragic 87.4% |
| Immigrants | Western Africa | 0.5 /100 | #259 | Tragic 87.4% |