Immigrants from Honduras vs Immigrants from Northern Europe 5th Grade
COMPARE
Immigrants from Honduras
Immigrants from Northern Europe
5th Grade
5th Grade Comparison
Immigrants from Honduras
Immigrants from Northern Europe
95.4%
5TH GRADE
0.0/ 100
METRIC RATING
331st/ 347
METRIC RANK
97.9%
5TH GRADE
99.6/ 100
METRIC RATING
64th/ 347
METRIC RANK
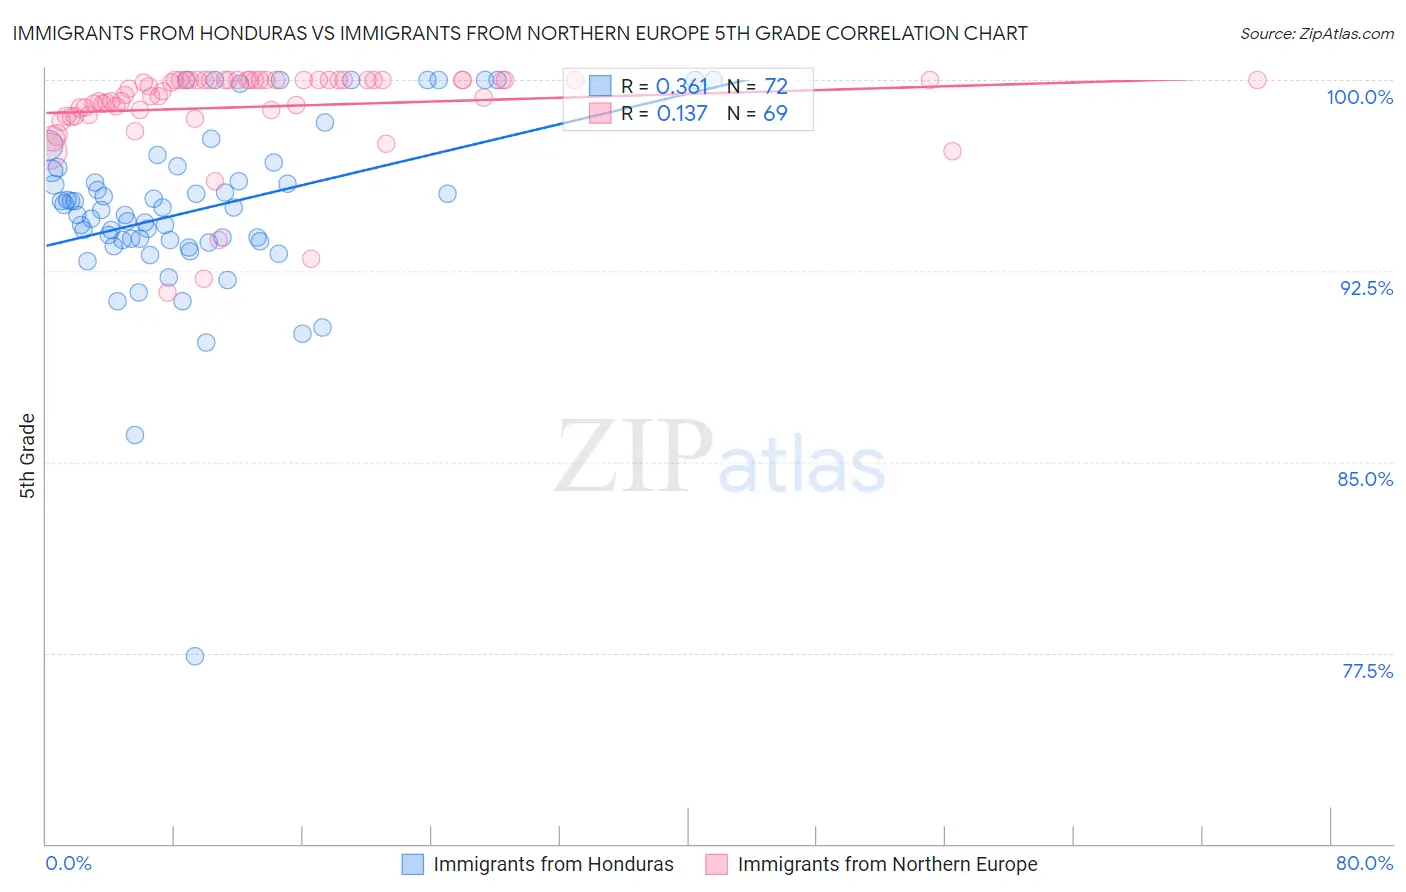
Immigrants from Honduras vs Immigrants from Northern Europe 5th Grade Correlation Chart
The statistical analysis conducted on geographies consisting of 322,637,445 people shows a mild positive correlation between the proportion of Immigrants from Honduras and percentage of population with at least 5th grade education in the United States with a correlation coefficient (R) of 0.361 and weighted average of 95.4%. Similarly, the statistical analysis conducted on geographies consisting of 477,226,800 people shows a poor positive correlation between the proportion of Immigrants from Northern Europe and percentage of population with at least 5th grade education in the United States with a correlation coefficient (R) of 0.137 and weighted average of 97.9%, a difference of 2.6%.
5th Grade Correlation Summary
| Measurement | Immigrants from Honduras | Immigrants from Northern Europe |
| Minimum | 77.4% | 91.7% |
| Maximum | 100.0% | 100.0% |
| Range | 22.6% | 8.3% |
| Mean | 94.9% | 99.0% |
| Median | 94.9% | 99.6% |
| Interquartile 25% (IQ1) | 93.7% | 98.7% |
| Interquartile 75% (IQ3) | 96.5% | 100.0% |
| Interquartile Range (IQR) | 2.8% | 1.3% |
| Standard Deviation (Sample) | 3.5% | 1.8% |
| Standard Deviation (Population) | 3.5% | 1.8% |
Similar Demographics by 5th Grade
Demographics Similar to Immigrants from Honduras by 5th Grade
In terms of 5th grade, the demographic groups most similar to Immigrants from Honduras are Immigrants from Armenia (95.4%, a difference of 0.050%), Immigrants from Dominican Republic (95.3%, a difference of 0.10%), Immigrants from Latin America (95.3%, a difference of 0.11%), Mexican American Indian (95.5%, a difference of 0.14%), and Nepalese (95.2%, a difference of 0.14%).
| Demographics | Rating | Rank | 5th Grade |
| Hondurans | 0.0 /100 | #324 | Tragic 95.6% |
| Hispanics or Latinos | 0.0 /100 | #325 | Tragic 95.6% |
| Immigrants | Cambodia | 0.0 /100 | #326 | Tragic 95.5% |
| Dominicans | 0.0 /100 | #327 | Tragic 95.5% |
| Cape Verdeans | 0.0 /100 | #328 | Tragic 95.5% |
| Mexican American Indians | 0.0 /100 | #329 | Tragic 95.5% |
| Immigrants | Armenia | 0.0 /100 | #330 | Tragic 95.4% |
| Immigrants | Honduras | 0.0 /100 | #331 | Tragic 95.4% |
| Immigrants | Dominican Republic | 0.0 /100 | #332 | Tragic 95.3% |
| Immigrants | Latin America | 0.0 /100 | #333 | Tragic 95.3% |
| Nepalese | 0.0 /100 | #334 | Tragic 95.2% |
| Mexicans | 0.0 /100 | #335 | Tragic 95.2% |
| Immigrants | Azores | 0.0 /100 | #336 | Tragic 95.1% |
| Central Americans | 0.0 /100 | #337 | Tragic 95.1% |
| Immigrants | Cabo Verde | 0.0 /100 | #338 | Tragic 94.9% |
Demographics Similar to Immigrants from Northern Europe by 5th Grade
In terms of 5th grade, the demographic groups most similar to Immigrants from Northern Europe are Canadian (97.9%, a difference of 0.0%), Immigrants from Austria (97.9%, a difference of 0.010%), New Zealander (97.9%, a difference of 0.010%), Serbian (97.9%, a difference of 0.020%), and Immigrants from North America (97.9%, a difference of 0.020%).
| Demographics | Rating | Rank | 5th Grade |
| Austrians | 99.8 /100 | #57 | Exceptional 97.9% |
| Whites/Caucasians | 99.8 /100 | #58 | Exceptional 97.9% |
| Americans | 99.7 /100 | #59 | Exceptional 97.9% |
| Immigrants | Canada | 99.7 /100 | #60 | Exceptional 97.9% |
| Serbians | 99.7 /100 | #61 | Exceptional 97.9% |
| Immigrants | North America | 99.7 /100 | #62 | Exceptional 97.9% |
| Russians | 99.7 /100 | #63 | Exceptional 97.9% |
| Immigrants | Northern Europe | 99.6 /100 | #64 | Exceptional 97.9% |
| Canadians | 99.6 /100 | #65 | Exceptional 97.9% |
| Immigrants | Austria | 99.6 /100 | #66 | Exceptional 97.9% |
| New Zealanders | 99.6 /100 | #67 | Exceptional 97.9% |
| Cajuns | 99.6 /100 | #68 | Exceptional 97.9% |
| Kiowa | 99.5 /100 | #69 | Exceptional 97.9% |
| Iranians | 99.5 /100 | #70 | Exceptional 97.9% |
| Chickasaw | 99.5 /100 | #71 | Exceptional 97.9% |