Immigrants from Haiti vs Jamaican 11th Grade
COMPARE
Immigrants from Haiti
Jamaican
11th Grade
11th Grade Comparison
Immigrants from Haiti
Jamaicans
89.9%
11TH GRADE
0.0/ 100
METRIC RATING
300th/ 347
METRIC RANK
91.4%
11TH GRADE
0.6/ 100
METRIC RATING
259th/ 347
METRIC RANK
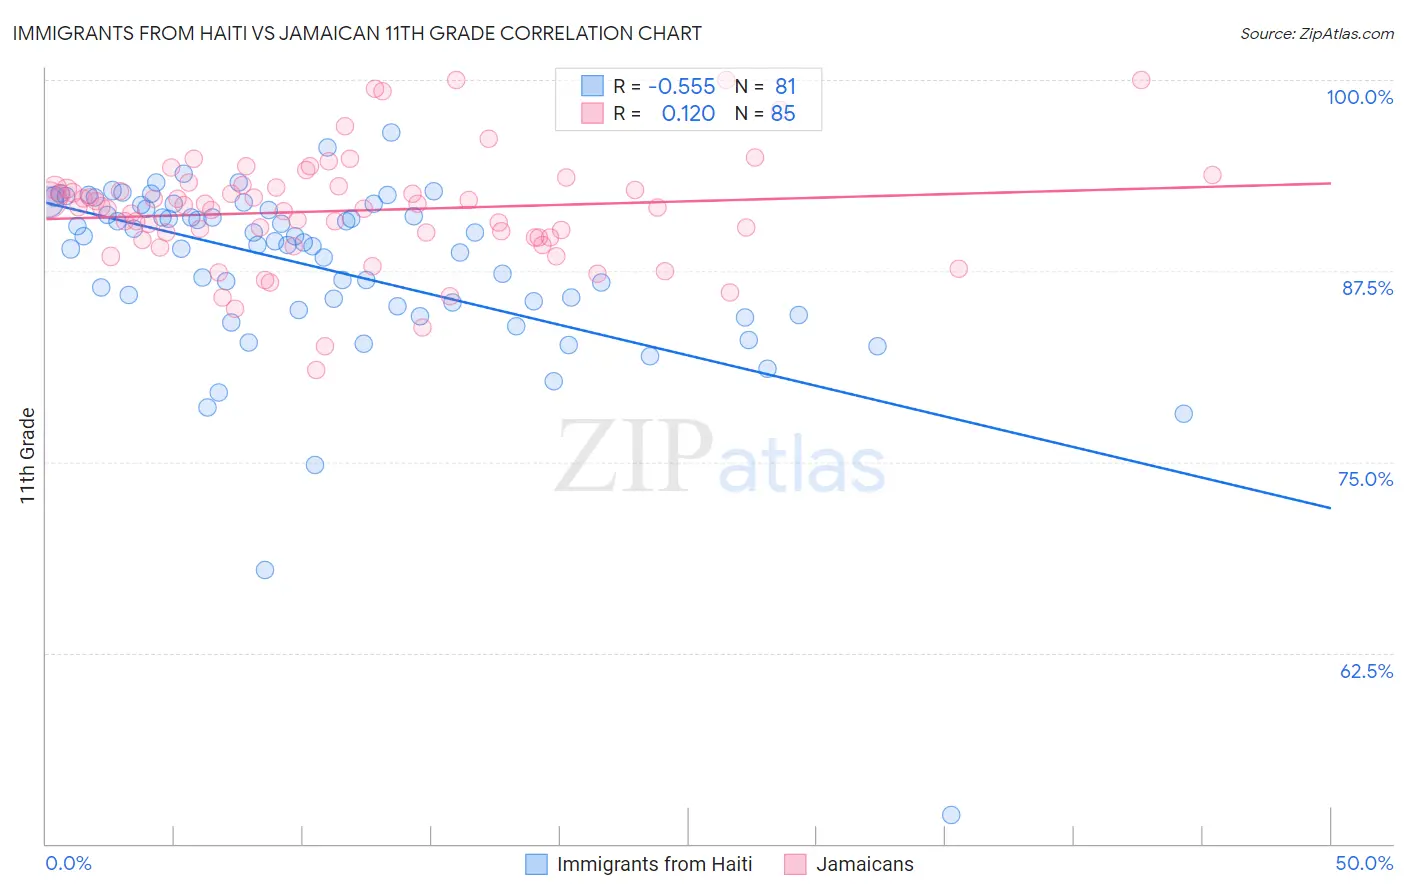
Immigrants from Haiti vs Jamaican 11th Grade Correlation Chart
The statistical analysis conducted on geographies consisting of 225,286,322 people shows a substantial negative correlation between the proportion of Immigrants from Haiti and percentage of population with at least 11th grade education in the United States with a correlation coefficient (R) of -0.555 and weighted average of 89.9%. Similarly, the statistical analysis conducted on geographies consisting of 368,084,732 people shows a poor positive correlation between the proportion of Jamaicans and percentage of population with at least 11th grade education in the United States with a correlation coefficient (R) of 0.120 and weighted average of 91.4%, a difference of 1.6%.
11th Grade Correlation Summary
| Measurement | Immigrants from Haiti | Jamaican |
| Minimum | 51.9% | 81.0% |
| Maximum | 96.6% | 100.0% |
| Range | 44.7% | 19.0% |
| Mean | 87.6% | 91.4% |
| Median | 89.3% | 91.7% |
| Interquartile 25% (IQ1) | 85.1% | 89.7% |
| Interquartile 75% (IQ3) | 91.7% | 93.0% |
| Interquartile Range (IQR) | 6.6% | 3.4% |
| Standard Deviation (Sample) | 6.3% | 3.6% |
| Standard Deviation (Population) | 6.3% | 3.6% |
Similar Demographics by 11th Grade
Demographics Similar to Immigrants from Haiti by 11th Grade
In terms of 11th grade, the demographic groups most similar to Immigrants from Haiti are Japanese (89.9%, a difference of 0.010%), Guyanese (89.9%, a difference of 0.010%), Immigrants from Fiji (89.9%, a difference of 0.040%), Navajo (90.0%, a difference of 0.11%), and Fijian (90.0%, a difference of 0.15%).
| Demographics | Rating | Rank | 11th Grade |
| Natives/Alaskans | 0.0 /100 | #293 | Tragic 90.2% |
| Immigrants | Grenada | 0.0 /100 | #294 | Tragic 90.1% |
| Immigrants | Vietnam | 0.0 /100 | #295 | Tragic 90.0% |
| Fijians | 0.0 /100 | #296 | Tragic 90.0% |
| Navajo | 0.0 /100 | #297 | Tragic 90.0% |
| Immigrants | Fiji | 0.0 /100 | #298 | Tragic 89.9% |
| Japanese | 0.0 /100 | #299 | Tragic 89.9% |
| Immigrants | Haiti | 0.0 /100 | #300 | Tragic 89.9% |
| Guyanese | 0.0 /100 | #301 | Tragic 89.9% |
| Immigrants | Guyana | 0.0 /100 | #302 | Tragic 89.7% |
| Immigrants | Immigrants | 0.0 /100 | #303 | Tragic 89.7% |
| Yuman | 0.0 /100 | #304 | Tragic 89.7% |
| Immigrants | Cambodia | 0.0 /100 | #305 | Tragic 89.6% |
| Ecuadorians | 0.0 /100 | #306 | Tragic 89.6% |
| Immigrants | Dominica | 0.0 /100 | #307 | Tragic 89.5% |
Demographics Similar to Jamaicans by 11th Grade
In terms of 11th grade, the demographic groups most similar to Jamaicans are Immigrants from Colombia (91.4%, a difference of 0.010%), Spanish American (91.4%, a difference of 0.010%), Taiwanese (91.3%, a difference of 0.010%), Cajun (91.4%, a difference of 0.030%), and Immigrants from Uruguay (91.3%, a difference of 0.030%).
| Demographics | Rating | Rank | 11th Grade |
| Immigrants | Nigeria | 0.8 /100 | #252 | Tragic 91.4% |
| Immigrants | South America | 0.8 /100 | #253 | Tragic 91.4% |
| Immigrants | Eritrea | 0.7 /100 | #254 | Tragic 91.4% |
| Blacks/African Americans | 0.7 /100 | #255 | Tragic 91.4% |
| Immigrants | Senegal | 0.7 /100 | #256 | Tragic 91.4% |
| Cajuns | 0.7 /100 | #257 | Tragic 91.4% |
| Immigrants | Colombia | 0.6 /100 | #258 | Tragic 91.4% |
| Jamaicans | 0.6 /100 | #259 | Tragic 91.4% |
| Spanish Americans | 0.6 /100 | #260 | Tragic 91.4% |
| Taiwanese | 0.6 /100 | #261 | Tragic 91.3% |
| Immigrants | Uruguay | 0.5 /100 | #262 | Tragic 91.3% |
| Immigrants | Ghana | 0.3 /100 | #263 | Tragic 91.2% |
| Yup'ik | 0.3 /100 | #264 | Tragic 91.2% |
| Pueblo | 0.3 /100 | #265 | Tragic 91.2% |
| Immigrants | Western Africa | 0.3 /100 | #266 | Tragic 91.2% |