Immigrants from Guyana vs Immigrants from Eastern Europe 8th Grade
COMPARE
Immigrants from Guyana
Immigrants from Eastern Europe
8th Grade
8th Grade Comparison
Immigrants from Guyana
Immigrants from Eastern Europe
93.8%
8TH GRADE
0.0/ 100
METRIC RATING
306th/ 347
METRIC RANK
96.0%
8TH GRADE
85.4/ 100
METRIC RATING
142nd/ 347
METRIC RANK
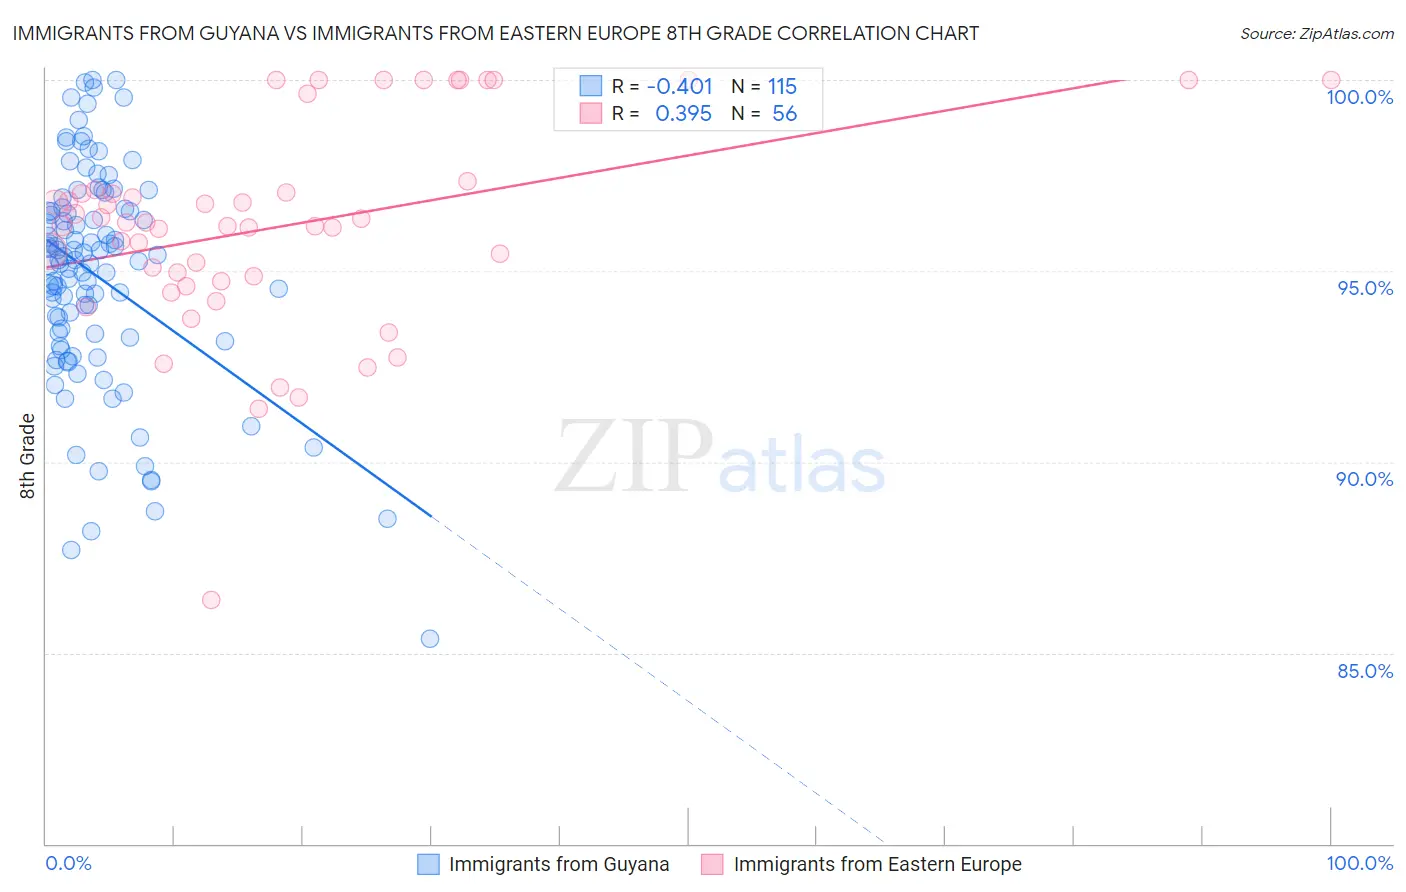
Immigrants from Guyana vs Immigrants from Eastern Europe 8th Grade Correlation Chart
The statistical analysis conducted on geographies consisting of 183,673,461 people shows a moderate negative correlation between the proportion of Immigrants from Guyana and percentage of population with at least 8th grade education in the United States with a correlation coefficient (R) of -0.401 and weighted average of 93.8%. Similarly, the statistical analysis conducted on geographies consisting of 475,879,420 people shows a mild positive correlation between the proportion of Immigrants from Eastern Europe and percentage of population with at least 8th grade education in the United States with a correlation coefficient (R) of 0.395 and weighted average of 96.0%, a difference of 2.4%.
8th Grade Correlation Summary
| Measurement | Immigrants from Guyana | Immigrants from Eastern Europe |
| Minimum | 85.4% | 86.4% |
| Maximum | 100.0% | 100.0% |
| Range | 14.6% | 13.6% |
| Mean | 94.9% | 96.2% |
| Median | 95.3% | 96.2% |
| Interquartile 25% (IQ1) | 93.3% | 94.8% |
| Interquartile 75% (IQ3) | 96.6% | 97.1% |
| Interquartile Range (IQR) | 3.3% | 2.3% |
| Standard Deviation (Sample) | 2.9% | 2.7% |
| Standard Deviation (Population) | 2.8% | 2.7% |
Similar Demographics by 8th Grade
Demographics Similar to Immigrants from Guyana by 8th Grade
In terms of 8th grade, the demographic groups most similar to Immigrants from Guyana are Immigrants from Portugal (93.8%, a difference of 0.010%), Immigrants from Haiti (93.9%, a difference of 0.090%), Guyanese (93.9%, a difference of 0.13%), Ecuadorian (93.6%, a difference of 0.18%), and Immigrants (93.6%, a difference of 0.20%).
| Demographics | Rating | Rank | 8th Grade |
| Cubans | 0.0 /100 | #299 | Tragic 94.1% |
| Immigrants | Burma/Myanmar | 0.0 /100 | #300 | Tragic 94.1% |
| Immigrants | Laos | 0.0 /100 | #301 | Tragic 94.1% |
| Sri Lankans | 0.0 /100 | #302 | Tragic 94.0% |
| Immigrants | Dominica | 0.0 /100 | #303 | Tragic 94.0% |
| Guyanese | 0.0 /100 | #304 | Tragic 93.9% |
| Immigrants | Haiti | 0.0 /100 | #305 | Tragic 93.9% |
| Immigrants | Guyana | 0.0 /100 | #306 | Tragic 93.8% |
| Immigrants | Portugal | 0.0 /100 | #307 | Tragic 93.8% |
| Ecuadorians | 0.0 /100 | #308 | Tragic 93.6% |
| Immigrants | Immigrants | 0.0 /100 | #309 | Tragic 93.6% |
| Japanese | 0.0 /100 | #310 | Tragic 93.6% |
| Immigrants | Bangladesh | 0.0 /100 | #311 | Tragic 93.6% |
| Cape Verdeans | 0.0 /100 | #312 | Tragic 93.5% |
| Immigrants | Caribbean | 0.0 /100 | #313 | Tragic 93.5% |
Demographics Similar to Immigrants from Eastern Europe by 8th Grade
In terms of 8th grade, the demographic groups most similar to Immigrants from Eastern Europe are Spanish (96.0%, a difference of 0.0%), Immigrants from Greece (96.0%, a difference of 0.010%), Immigrants from Belarus (96.0%, a difference of 0.010%), Lumbee (96.0%, a difference of 0.020%), and Israeli (96.0%, a difference of 0.020%).
| Demographics | Rating | Rank | 8th Grade |
| Basques | 91.5 /100 | #135 | Exceptional 96.1% |
| Jordanians | 91.3 /100 | #136 | Exceptional 96.1% |
| Cambodians | 90.6 /100 | #137 | Exceptional 96.1% |
| Burmese | 90.2 /100 | #138 | Exceptional 96.1% |
| Hmong | 89.7 /100 | #139 | Excellent 96.1% |
| Immigrants | South Central Asia | 89.4 /100 | #140 | Excellent 96.1% |
| Immigrants | Greece | 85.9 /100 | #141 | Excellent 96.0% |
| Immigrants | Eastern Europe | 85.4 /100 | #142 | Excellent 96.0% |
| Spanish | 85.1 /100 | #143 | Excellent 96.0% |
| Immigrants | Belarus | 84.8 /100 | #144 | Excellent 96.0% |
| Lumbee | 84.1 /100 | #145 | Excellent 96.0% |
| Israelis | 84.1 /100 | #146 | Excellent 96.0% |
| Colville | 84.0 /100 | #147 | Excellent 96.0% |
| Albanians | 83.1 /100 | #148 | Excellent 96.0% |
| Immigrants | Israel | 81.3 /100 | #149 | Excellent 96.0% |