Immigrants from Grenada vs Okinawan 2nd Grade
COMPARE
Immigrants from Grenada
Okinawan
2nd Grade
2nd Grade Comparison
Immigrants from Grenada
Okinawans
97.1%
2ND GRADE
0.0/ 100
METRIC RATING
295th/ 347
METRIC RANK
98.1%
2ND GRADE
94.9/ 100
METRIC RATING
120th/ 347
METRIC RANK
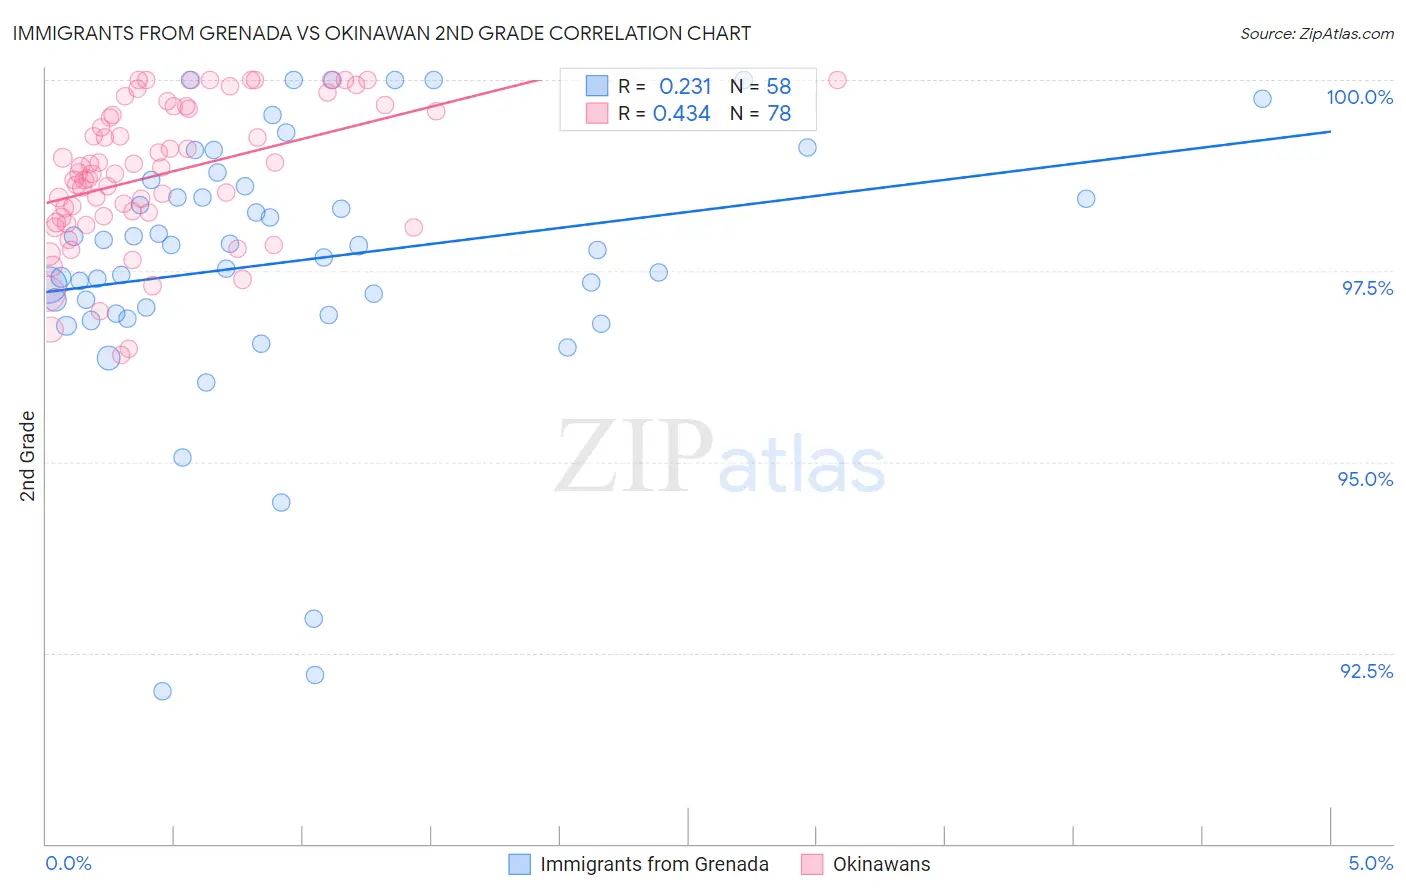
Immigrants from Grenada vs Okinawan 2nd Grade Correlation Chart
The statistical analysis conducted on geographies consisting of 67,200,336 people shows a weak positive correlation between the proportion of Immigrants from Grenada and percentage of population with at least 2nd grade education in the United States with a correlation coefficient (R) of 0.231 and weighted average of 97.1%. Similarly, the statistical analysis conducted on geographies consisting of 73,744,614 people shows a moderate positive correlation between the proportion of Okinawans and percentage of population with at least 2nd grade education in the United States with a correlation coefficient (R) of 0.434 and weighted average of 98.1%, a difference of 1.0%.
2nd Grade Correlation Summary
| Measurement | Immigrants from Grenada | Okinawan |
| Minimum | 92.0% | 96.4% |
| Maximum | 100.0% | 100.0% |
| Range | 8.0% | 3.6% |
| Mean | 97.6% | 98.8% |
| Median | 97.8% | 98.8% |
| Interquartile 25% (IQ1) | 96.9% | 98.2% |
| Interquartile 75% (IQ3) | 98.6% | 99.6% |
| Interquartile Range (IQR) | 1.7% | 1.4% |
| Standard Deviation (Sample) | 1.7% | 0.92% |
| Standard Deviation (Population) | 1.7% | 0.92% |
Similar Demographics by 2nd Grade
Demographics Similar to Immigrants from Grenada by 2nd Grade
In terms of 2nd grade, the demographic groups most similar to Immigrants from Grenada are Malaysian (97.1%, a difference of 0.020%), British West Indian (97.2%, a difference of 0.040%), Immigrants (97.1%, a difference of 0.040%), Immigrants from Eritrea (97.2%, a difference of 0.050%), and Houma (97.2%, a difference of 0.080%).
| Demographics | Rating | Rank | 2nd Grade |
| Immigrants | Thailand | 0.0 /100 | #288 | Tragic 97.2% |
| Houma | 0.0 /100 | #289 | Tragic 97.2% |
| Immigrants | St. Vincent and the Grenadines | 0.0 /100 | #290 | Tragic 97.2% |
| Immigrants | Afghanistan | 0.0 /100 | #291 | Tragic 97.2% |
| Immigrants | Eritrea | 0.0 /100 | #292 | Tragic 97.2% |
| British West Indians | 0.0 /100 | #293 | Tragic 97.2% |
| Malaysians | 0.0 /100 | #294 | Tragic 97.1% |
| Immigrants | Grenada | 0.0 /100 | #295 | Tragic 97.1% |
| Immigrants | Immigrants | 0.0 /100 | #296 | Tragic 97.1% |
| Immigrants | Cuba | 0.0 /100 | #297 | Tragic 97.0% |
| Immigrants | Dominica | 0.0 /100 | #298 | Tragic 97.0% |
| Haitians | 0.0 /100 | #299 | Tragic 97.0% |
| Immigrants | South Eastern Asia | 0.0 /100 | #300 | Tragic 97.0% |
| Central American Indians | 0.0 /100 | #301 | Tragic 97.0% |
| Somalis | 0.0 /100 | #302 | Tragic 97.0% |
Demographics Similar to Okinawans by 2nd Grade
In terms of 2nd grade, the demographic groups most similar to Okinawans are Spanish (98.1%, a difference of 0.010%), Ute (98.1%, a difference of 0.010%), Immigrants from France (98.1%, a difference of 0.010%), Thai (98.1%, a difference of 0.010%), and Immigrants from Zimbabwe (98.1%, a difference of 0.010%).
| Demographics | Rating | Rank | 2nd Grade |
| Immigrants | Norway | 96.5 /100 | #113 | Exceptional 98.1% |
| Immigrants | Latvia | 96.4 /100 | #114 | Exceptional 98.1% |
| Iranians | 95.9 /100 | #115 | Exceptional 98.1% |
| Spanish | 95.8 /100 | #116 | Exceptional 98.1% |
| Ute | 95.7 /100 | #117 | Exceptional 98.1% |
| Immigrants | France | 95.6 /100 | #118 | Exceptional 98.1% |
| Thais | 95.3 /100 | #119 | Exceptional 98.1% |
| Okinawans | 94.9 /100 | #120 | Exceptional 98.1% |
| Immigrants | Zimbabwe | 94.4 /100 | #121 | Exceptional 98.1% |
| Lebanese | 94.2 /100 | #122 | Exceptional 98.1% |
| Immigrants | Japan | 94.1 /100 | #123 | Exceptional 98.1% |
| Menominee | 94.1 /100 | #124 | Exceptional 98.1% |
| Iroquois | 94.1 /100 | #125 | Exceptional 98.1% |
| Syrians | 94.0 /100 | #126 | Exceptional 98.1% |
| Immigrants | Saudi Arabia | 93.6 /100 | #127 | Exceptional 98.1% |