Immigrants from Greece vs Immigrants from Uzbekistan Kindergarten
COMPARE
Immigrants from Greece
Immigrants from Uzbekistan
Kindergarten
Kindergarten Comparison
Immigrants from Greece
Immigrants from Uzbekistan
98.0%
KINDERGARTEN
74.9/ 100
METRIC RATING
149th/ 347
METRIC RANK
97.4%
KINDERGARTEN
0.1/ 100
METRIC RATING
278th/ 347
METRIC RANK
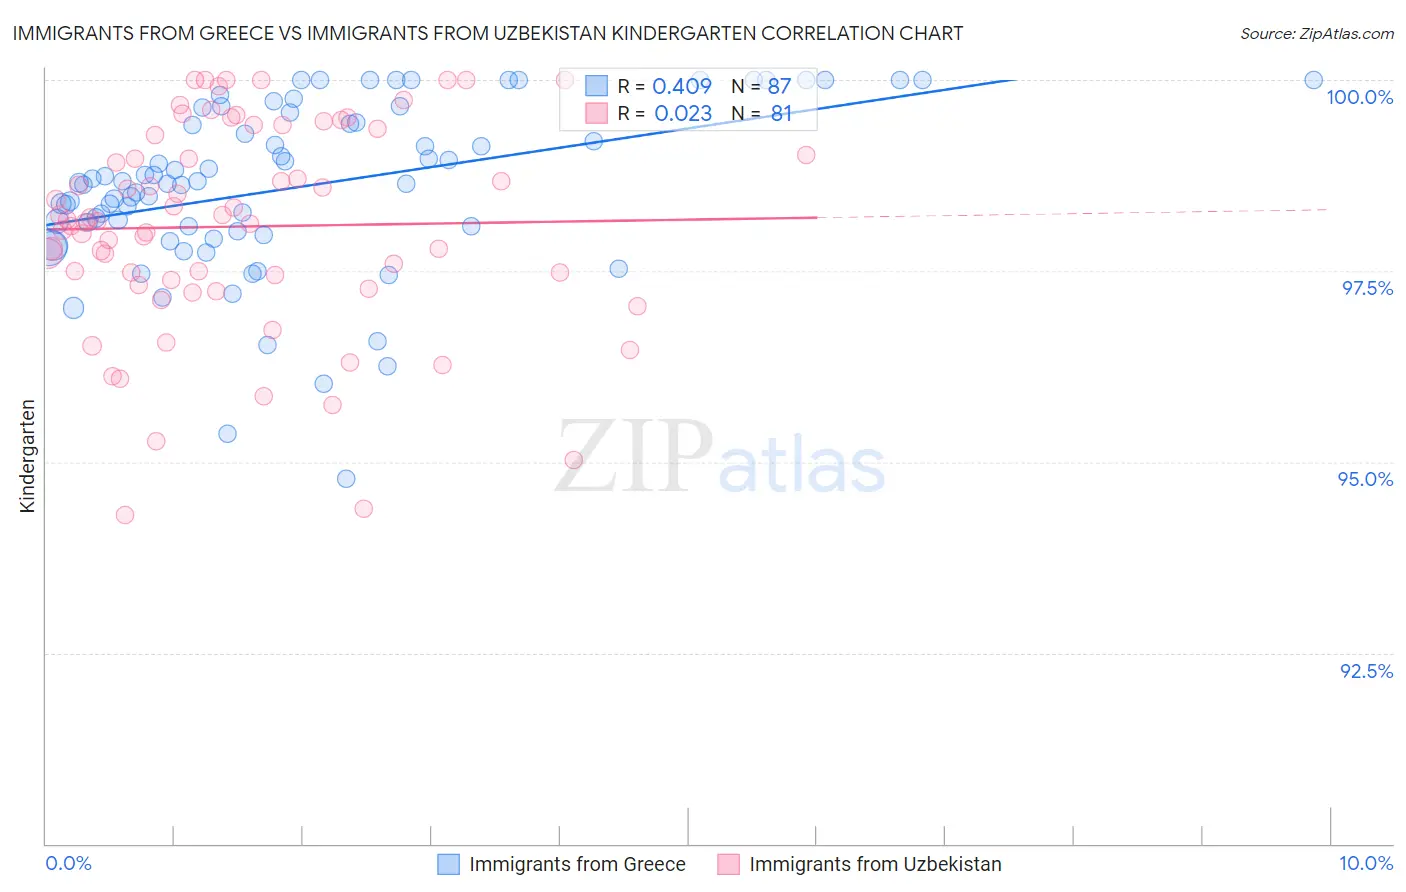
Immigrants from Greece vs Immigrants from Uzbekistan Kindergarten Correlation Chart
The statistical analysis conducted on geographies consisting of 216,879,847 people shows a moderate positive correlation between the proportion of Immigrants from Greece and percentage of population with at least kindergarten education in the United States with a correlation coefficient (R) of 0.409 and weighted average of 98.0%. Similarly, the statistical analysis conducted on geographies consisting of 118,593,934 people shows no correlation between the proportion of Immigrants from Uzbekistan and percentage of population with at least kindergarten education in the United States with a correlation coefficient (R) of 0.023 and weighted average of 97.4%, a difference of 0.66%.
Kindergarten Correlation Summary
| Measurement | Immigrants from Greece | Immigrants from Uzbekistan |
| Minimum | 94.8% | 94.3% |
| Maximum | 100.0% | 100.0% |
| Range | 5.2% | 5.7% |
| Mean | 98.6% | 98.1% |
| Median | 98.7% | 98.1% |
| Interquartile 25% (IQ1) | 98.0% | 97.3% |
| Interquartile 75% (IQ3) | 99.6% | 99.3% |
| Interquartile Range (IQR) | 1.5% | 2.0% |
| Standard Deviation (Sample) | 1.1% | 1.4% |
| Standard Deviation (Population) | 1.1% | 1.4% |
Similar Demographics by Kindergarten
Demographics Similar to Immigrants from Greece by Kindergarten
In terms of kindergarten, the demographic groups most similar to Immigrants from Greece are Apache (98.0%, a difference of 0.0%), Filipino (98.0%, a difference of 0.010%), Immigrants from Israel (98.0%, a difference of 0.010%), Jordanian (98.0%, a difference of 0.010%), and Alsatian (98.1%, a difference of 0.020%).
| Demographics | Rating | Rank | Kindergarten |
| Immigrants | Turkey | 82.8 /100 | #142 | Excellent 98.1% |
| Burmese | 81.5 /100 | #143 | Excellent 98.1% |
| Alsatians | 80.4 /100 | #144 | Excellent 98.1% |
| Hmong | 78.8 /100 | #145 | Good 98.1% |
| Filipinos | 78.3 /100 | #146 | Good 98.0% |
| Immigrants | Israel | 77.6 /100 | #147 | Good 98.0% |
| Apache | 75.0 /100 | #148 | Good 98.0% |
| Immigrants | Greece | 74.9 /100 | #149 | Good 98.0% |
| Jordanians | 72.8 /100 | #150 | Good 98.0% |
| Soviet Union | 70.8 /100 | #151 | Good 98.0% |
| Dutch West Indians | 70.1 /100 | #152 | Good 98.0% |
| Immigrants | Moldova | 69.1 /100 | #153 | Good 98.0% |
| Immigrants | Iran | 68.8 /100 | #154 | Good 98.0% |
| Comanche | 68.3 /100 | #155 | Good 98.0% |
| Immigrants | South Central Asia | 66.6 /100 | #156 | Good 98.0% |
Demographics Similar to Immigrants from Uzbekistan by Kindergarten
In terms of kindergarten, the demographic groups most similar to Immigrants from Uzbekistan are Immigrants from Ghana (97.4%, a difference of 0.010%), Barbadian (97.4%, a difference of 0.010%), Trinidadian and Tobagonian (97.4%, a difference of 0.010%), Immigrants from Western Africa (97.4%, a difference of 0.020%), and Afghan (97.4%, a difference of 0.020%).
| Demographics | Rating | Rank | Kindergarten |
| Immigrants | Peru | 0.2 /100 | #271 | Tragic 97.5% |
| Immigrants | Bolivia | 0.2 /100 | #272 | Tragic 97.5% |
| Immigrants | China | 0.1 /100 | #273 | Tragic 97.4% |
| Immigrants | Cameroon | 0.1 /100 | #274 | Tragic 97.4% |
| Ghanaians | 0.1 /100 | #275 | Tragic 97.4% |
| Immigrants | Philippines | 0.1 /100 | #276 | Tragic 97.4% |
| Immigrants | Western Africa | 0.1 /100 | #277 | Tragic 97.4% |
| Immigrants | Uzbekistan | 0.1 /100 | #278 | Tragic 97.4% |
| Immigrants | Ghana | 0.1 /100 | #279 | Tragic 97.4% |
| Barbadians | 0.1 /100 | #280 | Tragic 97.4% |
| Trinidadians and Tobagonians | 0.1 /100 | #281 | Tragic 97.4% |
| Afghans | 0.0 /100 | #282 | Tragic 97.4% |
| Immigrants | West Indies | 0.0 /100 | #283 | Tragic 97.3% |
| Immigrants | Trinidad and Tobago | 0.0 /100 | #284 | Tragic 97.3% |
| Immigrants | Portugal | 0.0 /100 | #285 | Tragic 97.3% |