Immigrants from Greece vs Immigrants from Liberia 10th Grade
COMPARE
Immigrants from Greece
Immigrants from Liberia
10th Grade
10th Grade Comparison
Immigrants from Greece
Immigrants from Liberia
94.3%
10TH GRADE
92.7/ 100
METRIC RATING
130th/ 347
METRIC RANK
93.3%
10TH GRADE
10.2/ 100
METRIC RATING
218th/ 347
METRIC RANK
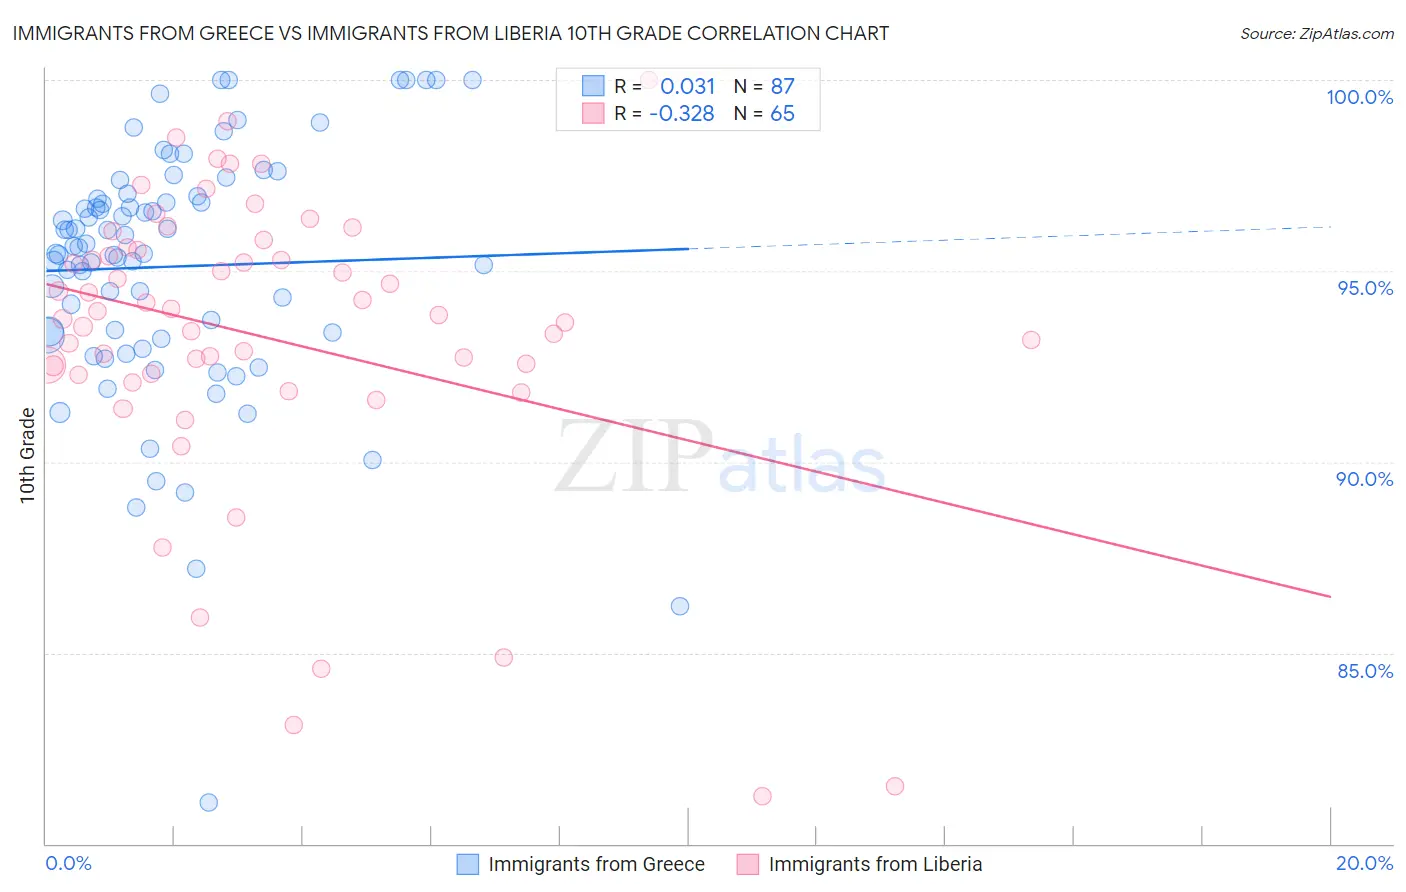
Immigrants from Greece vs Immigrants from Liberia 10th Grade Correlation Chart
The statistical analysis conducted on geographies consisting of 216,879,847 people shows no correlation between the proportion of Immigrants from Greece and percentage of population with at least 10th grade education in the United States with a correlation coefficient (R) of 0.031 and weighted average of 94.3%. Similarly, the statistical analysis conducted on geographies consisting of 135,295,697 people shows a mild negative correlation between the proportion of Immigrants from Liberia and percentage of population with at least 10th grade education in the United States with a correlation coefficient (R) of -0.328 and weighted average of 93.3%, a difference of 1.1%.
10th Grade Correlation Summary
| Measurement | Immigrants from Greece | Immigrants from Liberia |
| Minimum | 81.1% | 81.2% |
| Maximum | 100.0% | 100.0% |
| Range | 18.9% | 18.8% |
| Mean | 95.1% | 93.3% |
| Median | 95.6% | 93.8% |
| Interquartile 25% (IQ1) | 93.3% | 92.3% |
| Interquartile 75% (IQ3) | 97.0% | 95.6% |
| Interquartile Range (IQR) | 3.7% | 3.3% |
| Standard Deviation (Sample) | 3.3% | 3.9% |
| Standard Deviation (Population) | 3.3% | 3.9% |
Similar Demographics by 10th Grade
Demographics Similar to Immigrants from Greece by 10th Grade
In terms of 10th grade, the demographic groups most similar to Immigrants from Greece are Iroquois (94.3%, a difference of 0.0%), Immigrants from Eastern Europe (94.3%, a difference of 0.010%), Immigrants from Russia (94.3%, a difference of 0.010%), Potawatomi (94.3%, a difference of 0.030%), and Creek (94.2%, a difference of 0.030%).
| Demographics | Rating | Rank | 10th Grade |
| Cree | 95.1 /100 | #123 | Exceptional 94.4% |
| Basques | 94.9 /100 | #124 | Exceptional 94.3% |
| Americans | 94.4 /100 | #125 | Exceptional 94.3% |
| Immigrants | Iran | 94.4 /100 | #126 | Exceptional 94.3% |
| Israelis | 93.8 /100 | #127 | Exceptional 94.3% |
| Potawatomi | 93.6 /100 | #128 | Exceptional 94.3% |
| Iroquois | 92.8 /100 | #129 | Exceptional 94.3% |
| Immigrants | Greece | 92.7 /100 | #130 | Exceptional 94.3% |
| Immigrants | Eastern Europe | 92.5 /100 | #131 | Exceptional 94.3% |
| Immigrants | Russia | 92.4 /100 | #132 | Exceptional 94.3% |
| Creek | 91.9 /100 | #133 | Exceptional 94.2% |
| Osage | 91.7 /100 | #134 | Exceptional 94.2% |
| Immigrants | Korea | 91.3 /100 | #135 | Exceptional 94.2% |
| Shoshone | 90.8 /100 | #136 | Exceptional 94.2% |
| Arapaho | 90.5 /100 | #137 | Exceptional 94.2% |
Demographics Similar to Immigrants from Liberia by 10th Grade
In terms of 10th grade, the demographic groups most similar to Immigrants from Liberia are Seminole (93.3%, a difference of 0.0%), Tongan (93.3%, a difference of 0.020%), Portuguese (93.3%, a difference of 0.040%), Immigrants from Southern Europe (93.2%, a difference of 0.040%), and Ethiopian (93.2%, a difference of 0.070%).
| Demographics | Rating | Rank | 10th Grade |
| Cajuns | 16.9 /100 | #211 | Poor 93.4% |
| Immigrants | Zaire | 16.7 /100 | #212 | Poor 93.4% |
| Immigrants | Asia | 15.7 /100 | #213 | Poor 93.4% |
| Immigrants | Bahamas | 15.2 /100 | #214 | Poor 93.4% |
| Immigrants | Oceania | 15.1 /100 | #215 | Poor 93.4% |
| Immigrants | Eastern Africa | 14.7 /100 | #216 | Poor 93.4% |
| Portuguese | 12.1 /100 | #217 | Poor 93.3% |
| Immigrants | Liberia | 10.2 /100 | #218 | Poor 93.3% |
| Seminole | 10.2 /100 | #219 | Poor 93.3% |
| Tongans | 9.5 /100 | #220 | Tragic 93.3% |
| Immigrants | Southern Europe | 8.9 /100 | #221 | Tragic 93.2% |
| Ethiopians | 7.9 /100 | #222 | Tragic 93.2% |
| Immigrants | Sierra Leone | 7.6 /100 | #223 | Tragic 93.2% |
| Bolivians | 6.7 /100 | #224 | Tragic 93.2% |
| Somalis | 6.2 /100 | #225 | Tragic 93.2% |