Immigrants from Greece vs Greek 2nd Grade
COMPARE
Immigrants from Greece
Greek
2nd Grade
2nd Grade Comparison
Immigrants from Greece
Greeks
98.0%
2ND GRADE
76.8/ 100
METRIC RATING
147th/ 347
METRIC RANK
98.3%
2ND GRADE
99.8/ 100
METRIC RATING
62nd/ 347
METRIC RANK
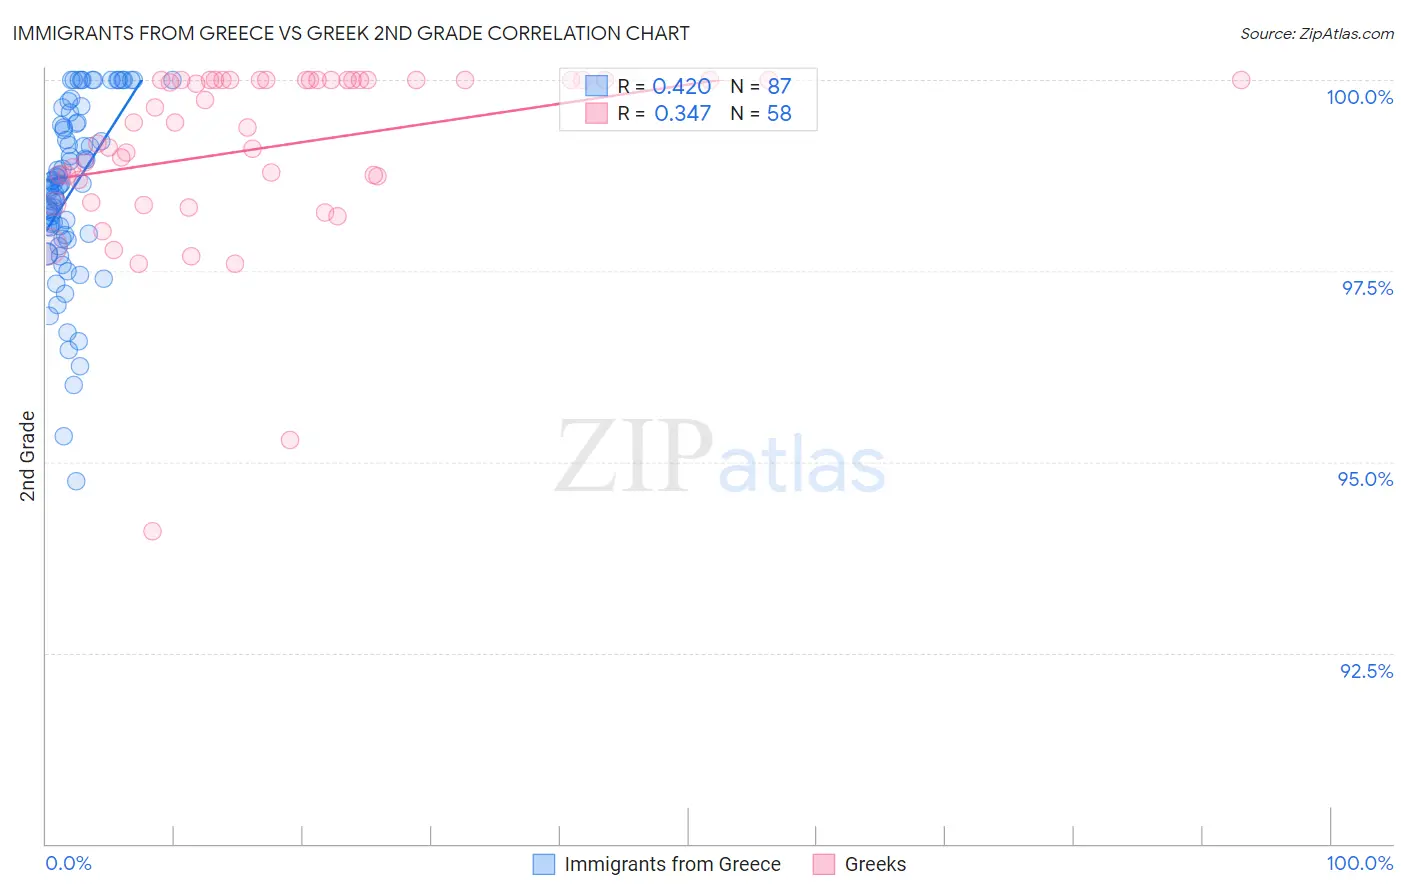
Immigrants from Greece vs Greek 2nd Grade Correlation Chart
The statistical analysis conducted on geographies consisting of 216,879,847 people shows a moderate positive correlation between the proportion of Immigrants from Greece and percentage of population with at least 2nd grade education in the United States with a correlation coefficient (R) of 0.420 and weighted average of 98.0%. Similarly, the statistical analysis conducted on geographies consisting of 482,775,358 people shows a mild positive correlation between the proportion of Greeks and percentage of population with at least 2nd grade education in the United States with a correlation coefficient (R) of 0.347 and weighted average of 98.3%, a difference of 0.38%.
2nd Grade Correlation Summary
| Measurement | Immigrants from Greece | Greek |
| Minimum | 94.8% | 94.1% |
| Maximum | 100.0% | 100.0% |
| Range | 5.2% | 5.9% |
| Mean | 98.6% | 99.1% |
| Median | 98.6% | 99.4% |
| Interquartile 25% (IQ1) | 98.0% | 98.7% |
| Interquartile 75% (IQ3) | 99.4% | 100.0% |
| Interquartile Range (IQR) | 1.5% | 1.3% |
| Standard Deviation (Sample) | 1.1% | 1.2% |
| Standard Deviation (Population) | 1.1% | 1.2% |
Similar Demographics by 2nd Grade
Demographics Similar to Immigrants from Greece by 2nd Grade
In terms of 2nd grade, the demographic groups most similar to Immigrants from Greece are Hmong (98.0%, a difference of 0.010%), Filipino (98.0%, a difference of 0.010%), Immigrants from Israel (98.0%, a difference of 0.010%), Jordanian (98.0%, a difference of 0.010%), and Apache (97.9%, a difference of 0.010%).
| Demographics | Rating | Rank | 2nd Grade |
| Palestinians | 83.9 /100 | #140 | Excellent 98.0% |
| Immigrants | Turkey | 83.0 /100 | #141 | Excellent 98.0% |
| Burmese | 81.0 /100 | #142 | Excellent 98.0% |
| Alsatians | 80.5 /100 | #143 | Excellent 98.0% |
| Hmong | 80.0 /100 | #144 | Good 98.0% |
| Filipinos | 79.2 /100 | #145 | Good 98.0% |
| Immigrants | Israel | 78.0 /100 | #146 | Good 98.0% |
| Immigrants | Greece | 76.8 /100 | #147 | Good 98.0% |
| Jordanians | 74.5 /100 | #148 | Good 98.0% |
| Apache | 74.0 /100 | #149 | Good 97.9% |
| Immigrants | Moldova | 72.9 /100 | #150 | Good 97.9% |
| Soviet Union | 70.7 /100 | #151 | Good 97.9% |
| Immigrants | North Macedonia | 68.5 /100 | #152 | Good 97.9% |
| Immigrants | South Central Asia | 68.3 /100 | #153 | Good 97.9% |
| Marshallese | 67.7 /100 | #154 | Good 97.9% |
Demographics Similar to Greeks by 2nd Grade
In terms of 2nd grade, the demographic groups most similar to Greeks are Slavic (98.3%, a difference of 0.0%), Creek (98.3%, a difference of 0.0%), Immigrants from Canada (98.3%, a difference of 0.0%), Maltese (98.3%, a difference of 0.0%), and Immigrants from North America (98.3%, a difference of 0.0%).
| Demographics | Rating | Rank | 2nd Grade |
| Immigrants | Scotland | 99.8 /100 | #55 | Exceptional 98.3% |
| Americans | 99.8 /100 | #56 | Exceptional 98.3% |
| Austrians | 99.8 /100 | #57 | Exceptional 98.3% |
| Bulgarians | 99.8 /100 | #58 | Exceptional 98.3% |
| Slavs | 99.8 /100 | #59 | Exceptional 98.3% |
| Creek | 99.8 /100 | #60 | Exceptional 98.3% |
| Immigrants | Canada | 99.8 /100 | #61 | Exceptional 98.3% |
| Greeks | 99.8 /100 | #62 | Exceptional 98.3% |
| Maltese | 99.7 /100 | #63 | Exceptional 98.3% |
| Immigrants | North America | 99.7 /100 | #64 | Exceptional 98.3% |
| New Zealanders | 99.7 /100 | #65 | Exceptional 98.3% |
| Canadians | 99.7 /100 | #66 | Exceptional 98.3% |
| Immigrants | Northern Europe | 99.7 /100 | #67 | Exceptional 98.3% |
| Russians | 99.7 /100 | #68 | Exceptional 98.3% |
| Immigrants | Austria | 99.6 /100 | #69 | Exceptional 98.3% |