Immigrants from Greece vs Bolivian College, 1 year or more

COMPARE

Immigrants from Greece
Race
Ancestry
AfghanAfricanAlaska NativeAlaskan AthabascanAlbanianAleutAlsatianAmericanApacheArabArapahoArgentineanArmenianAssyrian/Chaldean/SyriacAustralianAustrianBahamianBangladeshiBarbadianBasqueBelgianBelizeanBermudanBhutaneseBlackfeetBrazilianBritishBritish West IndianBulgarianBurmeseCajunCambodianCanadianCape VerdeanCarpatho RusynCelticCentral AmericanCentral American IndianCherokeeCheyenneChickasawChileanChineseChippewaChoctawColombianColvilleComancheCosta RicanCreeCreekCroatianCrowCubanCypriotCzechCzechoslovakianDanishDelawareDominicanDutchDutch West IndianEastern EuropeanEcuadorianEgyptianEnglishEstonianEthiopianEuropeanFijianFilipinoFinnishFrenchFrench American IndianFrench CanadianGermanGerman RussianGhanaianGreekGuamanian/ChamorroGuatemalanGuyaneseHaitianHmongHonduranHopiHoumaHungarianIcelanderIndian (Asian)IndonesianInupiatIranianIraqiIrishIroquoisIsraeliItalianJamaicanJapaneseJordanianKenyanKiowaKoreanLaotianLatvianLebaneseLiberianLithuanianLumbeeLuxembourgerMacedonianMalaysianMalteseMarshalleseMenomineeMexicanMexican American IndianMongolianMoroccanNative HawaiianNavajoNepaleseNew ZealanderNicaraguanNigerianNorthern EuropeanNorwegianOkinawanOsageOttawaPaiutePakistaniPalestinianPanamanianParaguayanPennsylvania GermanPeruvianPimaPolishPortuguesePotawatomiPuebloPuerto RicanPuget Sound SalishRomanianRussianSalvadoranSamoanScandinavianScotch-IrishScottishSeminoleSenegaleseSerbianShoshoneSierra LeoneanSiouxSlavicSlovakSloveneSomaliSouth AfricanSouth AmericanSouth American IndianSoviet UnionSpaniardSpanishSpanish AmericanSpanish American IndianSri LankanSubsaharan AfricanSudaneseSwedishSwissSyrianTaiwaneseThaiTlingit-HaidaTohono O'OdhamTonganTrinidadian and TobagonianTsimshianTurkishU.S. Virgin IslanderUgandanUkrainianUruguayanUteVenezuelanVietnameseWelshWest IndianYakamaYaquiYugoslavianYumanYup'ikZimbabwean
Immigration
NonimmigrantsImmigrantsAfghanistanAfricaAlbaniaArgentinaArmeniaAsiaAustraliaAustriaBahamasBangladeshBarbadosBelarusBelgiumBelizeBoliviaBosnia and HerzegovinaBrazilBulgariaBurma/MyanmarCabo VerdeCambodiaCameroonCanadaCaribbeanCentral AmericaChileChinaColombiaCongoCosta RicaCroatiaCubaCzechoslovakiaDenmarkDominicaDominican RepublicEastern AfricaEastern AsiaEastern EuropeEcuadorEgyptEl SalvadorEnglandEritreaEthiopiaEuropeFijiFranceGermanyGhanaGreeceGrenadaGuatemalaGuyanaHaitiHondurasHong KongHungaryIndiaIndonesiaIranIraqIrelandIsraelItalyJamaicaJapanJordanKazakhstanKenyaKoreaKuwaitLaosLatin AmericaLatviaLebanonLiberiaLithuaniaMalaysiaMexicoMicronesiaMiddle AfricaMoldovaMoroccoNepalNetherlandsNicaraguaNigeriaNorth AmericaNorth MacedoniaNorthern AfricaNorthern EuropeNorwayOceaniaPakistanPanamaPeruPhilippinesPolandPortugalRomaniaRussiaSaudi ArabiaScotlandSenegalSerbiaSierra LeoneSingaporeSomaliaSouth AfricaSouth AmericaSouth Central AsiaSouth Eastern AsiaSouthern EuropeSpainSri LankaSt. Vincent and the GrenadinesSudanSwedenSwitzerlandSyriaTaiwanThailandTrinidad and TobagoTurkeyUgandaUkraineUruguayUzbekistanVenezuelaVietnamWest IndiesWestern AfricaWestern AsiaWestern EuropeYemenZaireZimbabweAzores
Bolivian
Race
Ancestry
AfghanAfricanAlaska NativeAlaskan AthabascanAlbanianAleutAlsatianAmericanApacheArabArapahoArgentineanArmenianAssyrian/Chaldean/SyriacAustralianAustrianBahamianBangladeshiBarbadianBasqueBelgianBelizeanBermudanBhutaneseBlackfeetBolivianBrazilianBritishBritish West IndianBulgarianBurmeseCajunCambodianCanadianCape VerdeanCarpatho RusynCelticCentral AmericanCentral American IndianCherokeeCheyenneChickasawChileanChineseChippewaChoctawColombianColvilleComancheCosta RicanCreeCreekCroatianCrowCubanCypriotCzechCzechoslovakianDanishDelawareDominicanDutchDutch West IndianEastern EuropeanEcuadorianEgyptianEnglishEstonianEthiopianEuropeanFijianFilipinoFinnishFrenchFrench American IndianFrench CanadianGermanGerman RussianGhanaianGreekGuamanian/ChamorroGuatemalanGuyaneseHaitianHmongHonduranHopiHoumaHungarianIcelanderIndian (Asian)IndonesianInupiatIranianIraqiIrishIroquoisIsraeliItalianJamaicanJapaneseJordanianKenyanKiowaKoreanLaotianLatvianLebaneseLiberianLithuanianLumbeeLuxembourgerMacedonianMalaysianMalteseMarshalleseMenomineeMexicanMexican American IndianMongolianMoroccanNative HawaiianNavajoNepaleseNew ZealanderNicaraguanNigerianNorthern EuropeanNorwegianOkinawanOsageOttawaPaiutePakistaniPalestinianPanamanianParaguayanPennsylvania GermanPeruvianPimaPolishPortuguesePotawatomiPuebloPuerto RicanPuget Sound SalishRomanianRussianSalvadoranSamoanScandinavianScotch-IrishScottishSeminoleSenegaleseSerbianShoshoneSierra LeoneanSiouxSlavicSlovakSloveneSomaliSouth AfricanSouth AmericanSouth American IndianSoviet UnionSpaniardSpanishSpanish AmericanSpanish American IndianSri LankanSubsaharan AfricanSudaneseSwedishSwissSyrianTaiwaneseThaiTlingit-HaidaTohono O'OdhamTonganTrinidadian and TobagonianTsimshianTurkishU.S. Virgin IslanderUgandanUkrainianUruguayanUteVenezuelanVietnameseWelshWest IndianYakamaYaquiYugoslavianYumanYup'ikZimbabwean
Immigration
NonimmigrantsImmigrantsAfghanistanAfricaAlbaniaArgentinaArmeniaAsiaAustraliaAustriaBahamasBangladeshBarbadosBelarusBelgiumBelizeBoliviaBosnia and HerzegovinaBrazilBulgariaBurma/MyanmarCabo VerdeCambodiaCameroonCanadaCaribbeanCentral AmericaChileChinaColombiaCongoCosta RicaCroatiaCubaCzechoslovakiaDenmarkDominicaDominican RepublicEastern AfricaEastern AsiaEastern EuropeEcuadorEgyptEl SalvadorEnglandEritreaEthiopiaEuropeFijiFranceGermanyGhanaGrenadaGuatemalaGuyanaHaitiHondurasHong KongHungaryIndiaIndonesiaIranIraqIrelandIsraelItalyJamaicaJapanJordanKazakhstanKenyaKoreaKuwaitLaosLatin AmericaLatviaLebanonLiberiaLithuaniaMalaysiaMexicoMicronesiaMiddle AfricaMoldovaMoroccoNepalNetherlandsNicaraguaNigeriaNorth AmericaNorth MacedoniaNorthern AfricaNorthern EuropeNorwayOceaniaPakistanPanamaPeruPhilippinesPolandPortugalRomaniaRussiaSaudi ArabiaScotlandSenegalSerbiaSierra LeoneSingaporeSomaliaSouth AfricaSouth AmericaSouth Central AsiaSouth Eastern AsiaSouthern EuropeSpainSri LankaSt. Vincent and the GrenadinesSudanSwedenSwitzerlandSyriaTaiwanThailandTrinidad and TobagoTurkeyUgandaUkraineUruguayUzbekistanVenezuelaVietnamWest IndiesWestern AfricaWestern AsiaWestern EuropeYemenZaireZimbabweAzores
College, 1 year or more
Income
Poverty
Unemployment
Labor Participation
Family Structure
Vehicle Availability
Education Level
Disability

College, 1 year or more Comparison

Immigrants from Greece

Bolivians

Exceptional
Exceptional
63.3%
COLLEGE, 1 YEAR OR MORE
99.3/ 100
METRIC RATING
68th/ 347
METRIC RANK
63.5%
COLLEGE, 1 YEAR OR MORE
99.5/ 100
METRIC RATING
61st/ 347
METRIC RANK

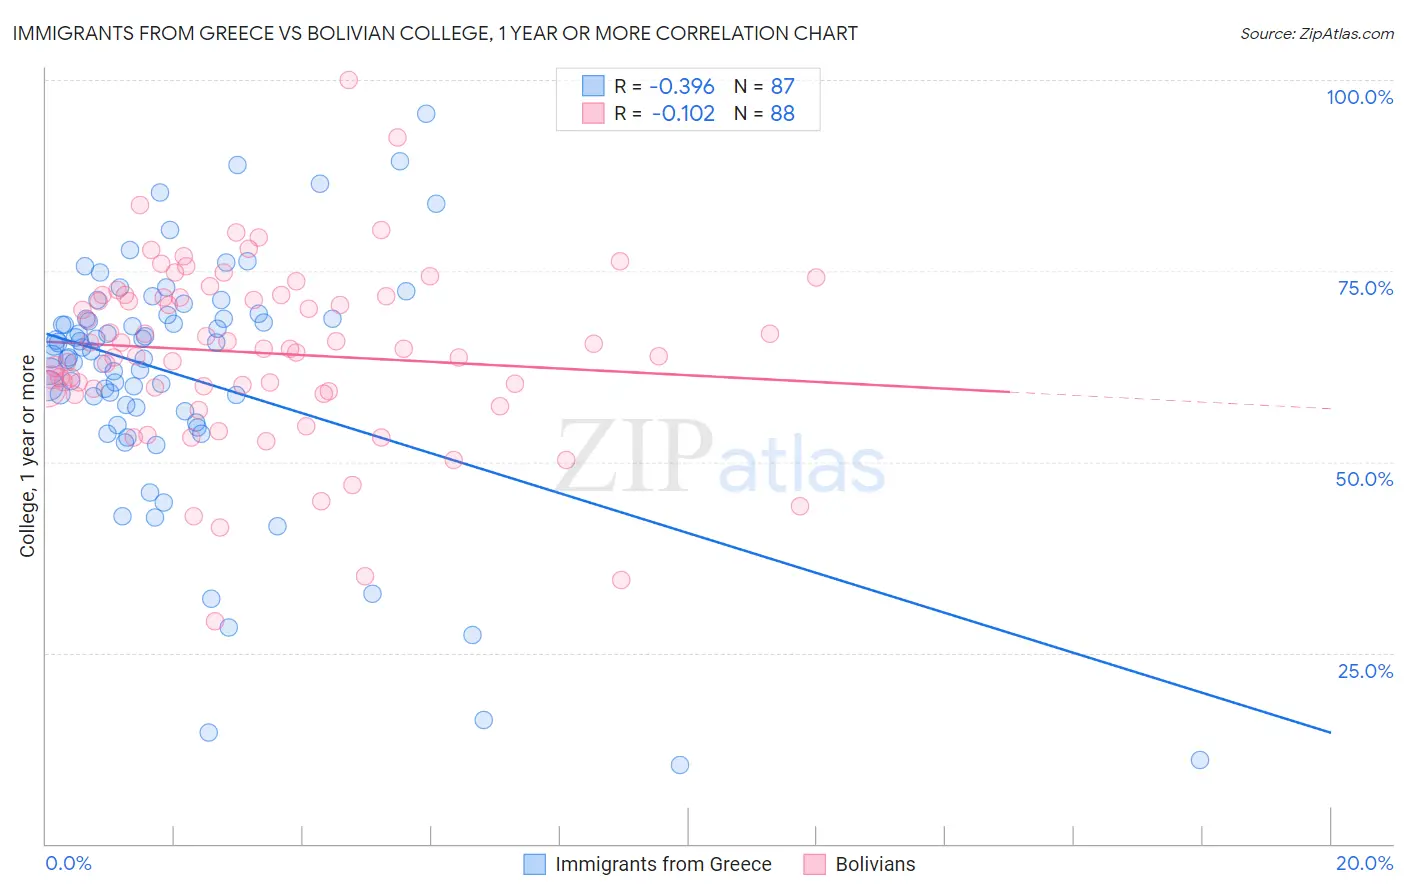
Immigrants from Greece vs Bolivian College, 1 year or more Correlation Chart

The statistical analysis conducted on geographies consisting of 216,878,684 people shows a mild negative correlation between the proportion of Immigrants from Greece and percentage of population with at least college, 1 year or more education in the United States with a correlation coefficient (R) of -0.396 and weighted average of 63.3%. Similarly, the statistical analysis conducted on geographies consisting of 184,669,815 people shows a poor negative correlation between the proportion of Bolivians and percentage of population with at least college, 1 year or more education in the United States with a correlation coefficient (R) of -0.102 and weighted average of 63.5%, a difference of 0.42%.
Immigrants from Greece vs Bolivian College, 1 year or more

College, 1 year or more Correlation Summary

MeasurementImmigrants from GreeceBolivian
Minimum10.3%29.1%
Maximum95.6%100.0%
Range85.3%70.9%
Mean61.2%64.3%
Median64.4%64.8%
Interquartile 25% (IQ1)56.6%59.4%
Interquartile 75% (IQ3)68.8%71.8%
Interquartile Range (IQR)12.2%12.4%
Standard Deviation (Sample)16.4%11.8%
Standard Deviation (Population)16.3%11.7%

Demographics Similar to Immigrants from Greece and Bolivians by College, 1 year or more

In terms of college, 1 year or more, the demographic groups most similar to Immigrants from Greece are Immigrants from Zimbabwe (63.3%, a difference of 0.0%), Immigrants from Romania (63.3%, a difference of 0.020%), Immigrants from Europe (63.3%, a difference of 0.030%), Argentinean (63.2%, a difference of 0.10%), and Maltese (63.4%, a difference of 0.14%). Similarly, the demographic groups most similar to Bolivians are Immigrants from Indonesia (63.5%, a difference of 0.010%), Immigrants from Kazakhstan (63.6%, a difference of 0.10%), Immigrants from Scotland (63.4%, a difference of 0.14%), Immigrants from Spain (63.4%, a difference of 0.18%), and Maltese (63.4%, a difference of 0.28%).
DemographicsRating | RankCollege, 1 year or more
Zimbabweans
99.8
/100
|
#54
Exceptional
64.2%
Immigrants | Belarus
99.7
/100
|
#55
Exceptional
64.1%
Immigrants | Czechoslovakia
99.7
/100
|
#56
Exceptional
64.1%
South Africans
99.7
/100
|
#57
Exceptional
64.1%
Immigrants | Asia
99.7
/100
|
#58
Exceptional
64.0%
Immigrants | Serbia
99.6
/100
|
#59
Exceptional
63.8%
Immigrants | Kazakhstan
99.5
/100
|
#60
Exceptional
63.6%
Bolivians
99.5
/100
|
#61
Exceptional
63.5%
Immigrants | Indonesia
99.5
/100
|
#62
Exceptional
63.5%
Immigrants | Scotland
99.4
/100
|
#63
Exceptional
63.4%
Immigrants | Spain
99.4
/100
|
#64
Exceptional
63.4%
Maltese
99.3
/100
|
#65
Exceptional
63.4%
Immigrants | Europe
99.3
/100
|
#66
Exceptional
63.3%
Immigrants | Romania
99.3
/100
|
#67
Exceptional
63.3%
Immigrants | Greece
99.3
/100
|
#68
Exceptional
63.3%
Immigrants | Zimbabwe
99.3
/100
|
#69
Exceptional
63.3%
Argentineans
99.2
/100
|
#70
Exceptional
63.2%
Immigrants | Canada
99.1
/100
|
#71
Exceptional
63.1%
Egyptians
99.0
/100
|
#72
Exceptional
63.1%
Immigrants | Moldova
99.0
/100
|
#73
Exceptional
63.0%
Immigrants | North America
99.0
/100
|
#74
Exceptional
63.0%